Travel Advisories Issued by U.S. State Department
Jump to: A, B, C, D, E, F, G, H, I, J, K, L, M, N, O, P, Q, R, S, T, U, V, Y, Z
Date Issued: Mon, 13 Jan 2025
Reissued after periodic review with updates to reflect the security environment, immigration information, and availability of medical care.
Do not travel to Afghanistan due to civil unrest, crime, terrorism, risk of wrongful detention, kidnapping, and limited health facilities.
Country Summary: The U.S. Embassy in Kabul suspended operations in 2021. The U.S. government is not able to provide routine or emergency consular services to U.S. citizens in Afghanistan.
Multiple terrorist groups are active in Afghanistan and U.S. citizens are targets of kidnapping and hostage-taking. The Taliban have harassed and detained aid and humanitarian workers. The activities of foreigners may be viewed with suspicion, and reasons for detention may be unclear. Even if you are registered with the appropriate authorities to conduct business, the risk of detention is high.
The Department has determined there is a risk of wrongful detention of U.S. nationals in Afghanistan. Additionally, Afghan-U.S. citizens and U.S. Lawful Permanent Residents (LPRs) who previously supported the United States (for example, as an interpreter) in Afghanistan may be targeted for detention.
The Taliban do not regularly permit the United States to conduct welfare checks on U.S. citizens in detention, including by phone. Detention can be lengthy. While in detention, U.S. citizens have limited or no access to medical attention and may be subject to physical abuse.
U.S. citizens should not travel to Afghanistan for any reason, including to accompany eligible family members for relocation. U.S. citizens or LPRs do not have to be physically present in Afghanistan for their qualifying family members to receive such assistance. For further information on how to assist your family members with the immigrant visa application process or to request relocation assistance for family, please refer to our website.
U.S. citizens in Afghanistan are urged to depart immediately via commercial means if possible. U.S. citizens who are seeking U.S. government assistance to depart should email complete biographic details and contact information (email and phone number), as well as U.S. passport number, to [email protected].
Basic medical care is available in major Afghan cities such as Kabul but is limited in rural areas.
Read the country information page for additional information on travel to Afghanistan.
If you choose to disregard the Travel Advisory and travel to Afghanistan:
- Review your personal security plans.
- Be aware of your surroundings and local security developments at all times.
- Keep a low profile.
- Monitor local media for breaking events and be prepared to adjust your plans.
- Keep travel documents up to date and easily accessible.
- Notify a trusted person of your travel and movement plans.
- Make contingency plans to leave when it is safe to do so that do not rely on U.S. government assistance.
- Draft a will and designate appropriate insurance beneficiaries and/or power of attorney.
- Discuss a plan with loved ones regarding care/custody of children, pets, property, belongings, non-liquid assets (collections, artwork, etc.), funeral wishes, etc.
- Leave DNA samples with your medical provider in case it is necessary for your family to access them.
- Enroll in the Smart Traveler Enrollment Program (STEP) to receive security updates and ensure you can be located in an emergency.
- Follow the Department of State on Facebook and Twitter/X.
- Consider the risks involved in traveling while possessing dual U.S. – Afghan nationality.
- Visit our website for Travel to High-Risk Areas.
- Read the Country Security Report For Afghanistan.
- Prepare a contingency plan for emergency situations. Review the Traveler’s Checklist.
- Visit the CDC page for the latest Travel Health Information related to your travel.
Date Issued: Tue, 31 Dec 2024
Reissued with obsolete COVID-19 page links removed.
Exercise increased caution in Albania due to crime.
Country Summary: Law enforcement’s ability to protect and assist travelers is limited in some areas, especially in remote regions. There has been targeted violence associated with illicit drug networks and organized crime countrywide. Travelers should remain aware of their surroundings and the extent of police and emergency services in their area.
Read the country information page for additional information to Albania.
If you decide to travel to Albania:
Date Issued: Thu, 26 Sep 2024
Reissued after periodic review with minor edits.
Exercise increased caution in Algeria due to terrorism and kidnapping.
Do not travel to:
- Areas near the eastern and southern borders due to terrorism and kidnapping.
- Areas in the Sahara Desert due to terrorism and kidnapping.
Country Summary: Terrorists continue plotting possible attacks in Algeria. Terrorists may attack with little or no warning and have recently targeted the Algerian security forces. Most attacks take place in rural areas, but attacks are possible in urban areas despite a heavy and active police presence.
The U.S. government has limited ability to provide emergency services to U.S. citizens outside Algiers province due to Algerian government restrictions on travel by U.S. government employees.
Read the country information page for additional information on travel to Algeria.
If you decide to travel to Algeria:
- Inform local police when visiting locations outside of major cities.
- Travel by air if possible; remain on major highways if you must travel by road.
- Travel with reputable travel agents who know the area.
- Avoid staying overnight outside of the main cities and tourist locations.
- Enroll in the Smart Traveler Enrollment Program (STEP) to receive Alerts and make it easier to locate you in an emergency.
- Follow the Department of State on Facebook and X/Twitter.
- Review the Country Security Report for Algeria.
- Visit the CDC page for the latest Travel Health Information related to your travel.
- Prepare a contingency plan for emergency situations. Review the Traveler’s Checklist.
Eastern and southern borders — Level 4: Do Not Travel
Avoid travel to rural areas within 50 km (31 miles) of the border with Tunisia and within 250 km (155 miles) of the borders with Libya, Niger, Mali, and Mauritania due to terrorist and criminal activities, including kidnapping.
Visit our website for High-Risk Travelers.
Overland travel to the Sahara Desert — Level 4: Do Not Travel
Do not travel overland in the Sahara Desert due to terrorist and criminal activity, including kidnapping.
Visit our website for High-Risk Travelers.
Date Issued: Tue, 25 Mar 2025
Reissued after periodic review with minor edits.
Exercise normal precautions when traveling to Andorra.
Country Summary: Travelers can enter Andorra only via Spain and France.
Read the country information page for more information on travel to Andorra.
If you decide to travel to Andorra:
Date Issued: Mon, 23 Sep 2024
Updated information on health-related issues.
Exercise increased caution in Angola due to crime and health. Some areas have increased risk. Read the entire Travel Advisory.
Violent crime, such as armed robbery, assault, carjacking, and homicide, is common. Local police lack the resources to respond effectively to serious criminal incidents.
Health facilities are under-resourced and may not have adequate facilities or supplies of basic vaccines or medications, especially outside of large cities. Always travel with required medicines, including a written prescription for any prescription medicine; most medicine is unavailable, and healthcare is inconsistent.
Read the Country Information Page for additional information on travel to Angola.
If you decide to travel to Angola:
Date Issued: Thu, 22 Aug 2024
Reissued after periodic review with minor edits.
Exercise normal precautions in Anguilla.
Read the country information page for additional information on travel to Anguilla.
If you decide to travel to Anguilla:
Date Issued: Tue, 23 Sep 2025
Exercise increased caution in Antarctica due to environmental hazards posed by extreme and unpredictable weather and limited emergency services.
There are no U.S. government consular services available to U.S. citizens in the Antarctic Region. The closest U.S embassies and consulates are in Argentina, Australia, Chile, New Zealand, and South Africa. U.S. government resources in the Antarctic Region are committed to the U.S. Antarctic Program, per longstanding U.S. policy.
Date Issued: Thu, 22 Aug 2024
Reissued after periodic review with minor edits.
Exercise normal precautions in Antigua and Barbuda.
Read the country information page for additional information on travel to Antigua and Barbuda.
If you decide to travel to Antigua and Barbuda:
Date Issued: Fri, 20 Sep 2024
Reissued with updates to crime information.
Exercise normal precautions in Argentina. Some areas have increased risk. Read the entire Travel Advisory.
Exercise increased caution in:
- City of Rosario (Santa Fe province) due to crime.
Read the country information page for additional information on travel to Argentina.
If you decide to travel to Argentina:
City of Rosario – Level 2: Exercise Increased Caution
Criminal and narcotics trafficking elements are active in Rosario (Santa Fe province) resulting in increased crime and violence.
U.S. Embassy personnel are required to give advance notice before traveling to Rosario.
Date Issued: Fri, 05 Sep 2025
Reissued after periodic review with minor edits.
Exercise increased caution in Armenia due to areas of potential armed conflict. Some areas have increased risk. Read the entire Travel Advisory.
Do Not Travel To These Areas for Any Reason:
- The border region with Azerbaijan.
U.S. Embassy employees and their families cannot travel to these areas for non-essential reasons:
- Gegharkunik region east of Vardenis
- Syunik region east of Goris
- Syunik region south of Kapan
Travel through Yeraskh village in Ararat region is allowed, stopping is not.
Country Summary:
U.S. citizens should exercise increased caution in Armenia. Further military activity could occur in the region.
Read the country information page for additional information on travel to Armenia.
If you decide to travel to Armenia:
Border with Azerbaijan – Level 4: Do Not Travel
Past military action has occurred near the Armenia-Azerbaijan border and there is potential for armed conflict in the area. U.S. citizens should avoid the area. Exercise caution on roads near Armenia’s border with Azerbaijan. Some parts of the road may cross international borders without warning. Checkpoints may control roads or authorities may close them to travelers without notice. The U.S. embassy does not allow embassy employees and their families to travel for non-essential reasons to the border region, as well as other areas of Armenia listed in this Travel Advisory.
Visit our website for Travel to High-Risk Areas.
Date Issued: Mon, 19 Aug 2024
Reissued after periodic review without changes.
Exercise normal precautions in Aruba.
Read the country information page for additional information on travel to Aruba.
If you decide to travel to Aruba:
Date Issued: Fri, 30 May 2025
Reissued after periodic review with minor edits.
Exercise normal precautions in Australia.
Read the country information page for additional information on travel to Australia.
If you decide to travel to Australia:
Date Issued: Fri, 23 Aug 2024
Reissued after periodic review without changes.
Exercise normal precautions in Austria.
Read the country information page for additional information on travel to Austria.
If you decide to travel to Austria:
Date Issued: Wed, 21 May 2025
Reissued after periodic review with minor edits.
Exercise increased caution in Azerbaijan due to terrorism. Some areas have increased risk. Read the entire Travel Advisory.
Do not travel to:
- The border region with Armenia due to potential for armed conflict.
- The former Soviet-era Nagorno Karabakh Autonomous Oblast and surrounding territories due to landmines.
Country Summary: Terrorist groups continue to plan attacks and are a risk in Azerbaijan. Terrorists may attack with little or no warning. They may target:
- Tourist locations
- Transportation centers (airports)
- Markets and shopping malls
- Local government buildings
- Hotels, clubs and restaurants
- Places of worship
- Parks
- Major sporting and cultural events
- Educational institutions
- Other public areas
Read the country information page for additional information on travel to Azerbaijan.
If you decide to travel to Azerbaijan:
Level 4: Do Not Travel – Border with Armenia
There is the potential for fighting along the Azerbaijan-Armenia border. U.S. citizens should avoid the area.
Exercise caution on roads near Azerbaijan’s border with Armenia:
- Be aware that some portions of the road may cross international boundaries without notice.
- Roads may be controlled by checkpoints or closed to travelers without notice.
- Due to the risks, U.S. government employees working in Azerbaijan are prohibited from non-essential travel to the border region.
Visit our website for Travel to High-Risk Areas.
Level 4: Do Not Travel – Former Soviet-era Nagorno Karabakh Autonomous Oblast and surrounding territories
Following armed hostilities in 2023, the former Soviet-era Nagorno Karabakh Autonomous Oblast and surrounding territories are under the control of Azerbaijan. Despite the cessation of fighting, the dangers posed by landmine contamination continue. Due to the risks, the U.S. government is unable to provide emergency services to U.S. citizens in the former Soviet-era Nagorno Karabakh Autonomous Oblast and surrounding territories, because U.S. government employees are prohibited from traveling there and Azerbaijan restricts access to the region.
Visit our website for Travel to High-Risk Areas.
Border with Armenia– Level 4: Do Not Travel
There is the potential for fighting along the Azerbaijan-Armenia border as part of the ongoing armed conflict. U.S. citizens should avoid the area. Exercise caution on roads near Azerbaijan’s border with Armenia. Be aware that some portions of the road may cross international boundaries without notice. Roads may be controlled by checkpoints or closed to travelers without notice. The U.S. embassy has prohibited embassy employees and their families from non-essential travel to the border region.
Nagorno-Karabakh – Level 4: Do Not Travel
The U.S. government is unable to provide emergency services to U.S. citizens in and around Nagorno-Karabakh due to landmine contamination and restricted access.
Date Issued: Mon, 09 Sep 2024
Reissued after periodic review without changes.
Exercise increased caution in Bahrain due to terrorism.
Country Summary: Terrorist groups continue plotting possible attacks in Bahrain. Terrorists may attack with little or no warning. Targets may include tourist sites, transportation hubs, markets, shopping malls, and government facilities.
Read the country information page for additional information on travel to Bahrain.
If you decide to travel to Bahrain:
Date Issued: Tue, 20 Jan 2026
There were no changes to the advisory level or risk indicators. Advisory summary was updated.
Reconsider travel to Bangladesh due to kidnapping, unrest, crime, and terrorism. Some areas have increased risk. Read the entire Travel Advisory.
Advisory summary
Unrest
Unrest and violence have decreased since summer 2024 with the formation of the Interim Government. Occasional protests continue with the potential for violent clashes. Conditions may change on short notice. U.S. citizens should avoid all gatherings, even peaceful ones. They can turn violent quickly without warning.
Crime
In Bangladesh’s major cities, common crimes include muggings, burglaries, assaults, and illegal drug trafficking.
Stay aware of petty crime, such as pickpocketing, in crowded areas. These crimes tend to be situational, based on time and location. There is no evidence that foreigners are targeted because of their nationality.
Terrorism
Terrorist violence is a risk in Bangladesh. This includes terrorist attacks and other activity. Visit the U.S. Department of State’s country reports on terrorism to learn more.
Kidnapping
Review the following risks in specific areas information on the Chittagong Hill Tracts Region for a description of kidnapping risks.
Travel restrictions for U.S. government employees
U.S. citizens in Bangladesh should take the same precautions as U.S. embassy employees.
- Due to security risks, U.S. government employees working in Bangladesh cannot travel outside the diplomatic enclave for non-essential reasons. They must take extra security and accountability precautions if they do.
- U.S. government employees in Bangladesh can travel freely within the diplomatic enclave.
The U.S. government has limited ability to provide emergency services to U.S. citizens in Bangladesh, particularly outside of Dhaka. This is due to these travel restrictions, a lack of infrastructure, and few emergency response resources from the local government.
Level 4 – Do Not Travel – Chittagong Hill Tracts Region
Do not travel to the Chittagong Hill Tracts due to unrest, crime, terrorism, and kidnapping. This area includes Khagrachari, Rangamati, and Bandarban Hill Tracts districts. Do not travel to this area for any reason.
- Kidnappings have happened in the region. Some are due to family disputes, while others target religious minorities.
- Separatist groups and political violence create more risks for visitors. There have been cases of IED explosions and active shootings.
- You must get prior approval from the Ministry of Home Affairs Office of Public Safety in Bangladesh if you want to travel to these areas.
- Due to the risks, U.S. government employees in Bangladesh cannot travel to the region. The Government of Bangladesh has imposed these restrictions.
- Visit our website Travel to High-Risk Areas.
If you decide to travel to Bangladesh:
- Avoid demonstrations and political gatherings. Demonstrations intended to be peaceful can turn violent.
- Review our information on U.S. Citizens Missing Abroad, Crime Abroad and for Victims of Crime.
- Have a plan to leave in an emergency that does not depend on U.S. government help. Review our information on Crisis and Evacuations.
- Review our information on Terrorism and Travel to High-Risk Areas.
- Monitor local media for breaking news. Be prepared to adjust your plans.
- Do not physically resist any robbery attempt. Get to a safe area and report any criminal incident to local authorities.
- Enroll in the Smart Traveler Enrollment Program (STEP) to get important updates and alerts from the U.S. embassy. Enrolling helps the U.S. embassy contact you or your emergency contact in an emergency.
- Review the Country Security Report for Bangladesh.
- Visit the U.S. Centers for Disease Control and Prevention (CDC) website for the latest Travel Health Information for Bangladesh.
- Whether you’re a first time or frequent traveler, use the International Travel Checklist.
- We highly recommend that you buy travel insurance before you travel. Check with your travel insurance provider about evacuation assistance, medical insurance, and trip cancelation coverageDo not travel to the Chittagong Hill Tracts due to unrest, crime, terrorism, and kidnapping. This area includes Khagrachari, Rangamati, and Bandarban Hill Tracts districts. Do not travel to this area for any reason.
- Kidnappings have happened in the region. Some are due to family disputes, while others target religious minorities.
- Separatist groups and political violence create more risks for visitors. There have been cases of IED explosions and active shootings.
- You must get prior approval from the Ministry of Home Affairs Office of Public Safety in Bangladesh if you want to travel to these areas.
- Due to the risks, U.S. government employees in Bangladesh cannot travel to the region. The Government of Bangladesh has imposed these restrictions.
- Visit our website Travel to High-Risk Areas.
Date Issued: Thu, 22 Aug 2024
Reissued after periodic review with minor edits.
Exercise normal precautions in Barbados.
Read the country information page for additional information on travel to Barbados.
If you decide to travel to Barbados:
Date Issued: Mon, 29 Dec 2025
Do not travel to Belarus for any reason due to unrest and other risks.
The U.S. government has extremely limited ability to help detained U.S. citizens. You may not receive consular access. You could also face arbitrary detention with no contact with the outside world.
On February 28, 2022, the U.S. Department of State ordered the departure of U.S. government employees. It also suspended operations at U.S. Embassy Minsk.
There are no consular services, routine or emergency, until further notice. The U.S. government has severely limited ability to assist U.S. citizens in Belarus. U.S. citizens in Belarus who require consular services should leave the country immediately. Please contact a U.S. embassy or consulate in another country.
Belarus does not recognize dual nationality. Belarus will not recognize your U.S. citizenship if you are a dual U.S.-Belarusian citizen or have a claim to Belarusian citizenship.
- Belarus repeatedly has blocked U.S. consular officers from visiting detained dual U.S.-Belarusian citizens.
- The Belarusian government has prevented dual U.S.-Belarusian citizens from departing the country. In some cases, it has forced dual citizens into mandatory military service.
In Belarus, freedom of expression, association, and peaceful assembly are not protected rights.
- U.S. citizens should avoid demonstrations.
- Belarusian authorities have used excessive force to disperse demonstrators, including people peacefully demonstrating. Bystanders, including foreign nationals, face the possibility of arbitrary arrest or detention.
- U.S. citizens near demonstrations have been arrested. Some have been victims of harassment or mistreatment by Belarusian officials.
- Belarusian officials unevenly enforce laws and regulations. Belarusian authorities have targeted people linked to independent and foreign media.
- Belarusian authorities have detained tens of thousands of people, including many imprisoned for political activities that may not be considered crimes in the United States. This includes U.S. citizens tied to opposition parties or political protests, even if they happened outside Belarus.
Belarusian detention facilities are extremely poor. There are credible reports that authorities mistreat and abuse prisoners while in custody.
- The Belarusian authorities have denied prisoners access to their embassy and lawyers. They have restricted communication with family outside prison.
Reconsider bringing electronic devices into Belarus.
U.S. citizens should assume all electronic communications and devices in Belarus are monitored.
- Belarusian security services have arrested U.S. citizens and other foreign nationals based on information found on electronic devices. This includes data created, sent, or stored while in another country.
There are few commercial air travel options available to and from Belarus.
- Flights could be unavailable on short notice. The availability of other transportation options could change at any time.
- Those wishing to leave Belarus should make their own travel plans. The U.S. government cannot help U.S. citizens trying to leave.
- Border crossings with neighboring states sometimes close with little notice. U.S. citizens should regularly reevaluate departure plans in the event of an emergency.
On May 23, 2021, Belarusian authorities made a commercial plane land improperly. They did this to arrest an opposition journalist on board. EU airlines now avoid Belarusian airspace.
On February 24, 2022, the Federal Aviation Administration (FAA) issued an ongoing Advisory Notice to Airmen (NOTAM). It bans U.S. air carriers and commercial operators, U.S. pilots, and U.S. registered aircraft from operating in the Minsk Flight Information Region (UMMV). This is due to safety-of-flight risks from ongoing hostilities in Belarus.
The Federal Aviation Administration’s Prohibitions, Restrictions and Notices includes more information.
Date Issued: Thu, 22 May 2025
Reissued after periodic review with minor edits.
Exercise increased caution in Belgium due to terrorism.
Country Summary: There is a risk of terrorist violence, including terrorist attacks and other related activities in Belgium.
Terrorists may attack with little or no warning. They target:
- Tourist locations
- Transportation hubs (e.g. airports, train stations, mass transit)
- Markets and shopping malls
- Local government buildings
- Hotels, clubs, and restaurants
- Places of worship
- Parks
- Major sporting, music, and cultural events
- Schools
- Public areas
Visit the U.S. Department of State’s country reports on terrorism to learn more.
Read the country information page for additional information on travel to Belgium.
If you decide to travel to Belgium:
- Stay alert in tourist spots.
- Enroll in the Smart Traveler Enrollment Program (STEP) to receive messages and Alerts from the U.S. Embassy and make it easier to locate you in an emergency.
- Review the Country Security Report for Belgium.
- Prepare a plan for emergency situations. Review the Traveler’s Checklist.
- Visit the CDC page for the latest Travel Health Information related to your travel and return to the United States.
- We highly recommend that you buy insurance before you travel. Check with your travel insurance provider about evacuation assistance, medical insurance, and trip cancellation coverage.
Date Issued: Mon, 30 Dec 2024
Reissued after periodic review with minor edits.
Exercise increased caution in Belize due to crime. Some areas have increased risk. Please read the entire Travel Advisory.
Country Summary: Violent crime – such as sexual assault, home invasions, armed robberies, and murder – are common even during the day and in tourist areas. A significant portion of violent crime is gang related. Due to high crime, travelers are advised to exercise caution while traveling to the south side of Belize City. Local police lack the resources and training to respond effectively to serious crimes. Most crimes remain unresolved and unprosecuted.
Read the country information page for additional information on travel to Belize.
If you decide to travel to Belize:
- Be aware of your surroundings.
- Avoid walking or driving at night.
- Do not physically resist any robbery attempt.
- Be extra vigilant when visiting banks or ATMs.
- Do not display signs of wealth, such as wearing expensive watches or jewelry.
- Enroll in the Smart Traveler Enrollment Program (STEP) to receive alerts and make it easier to locate you in an emergency.
- Follow the Department of State on Facebook and X/Twitter.
- Review the Country Security Report for Belize.
- Prepare a contingency plan for emergency situations. Review the Traveler’s Checklist.
- Visit the CDC page for the latest Travel Health Information related to your travel.
Belize City – Level 3: Reconsider Travel
U.S. citizens should avoid traveling to Belize City. Historically much of the violent crime in Belize occurs in the Southside of Belize City and is gang related. This area (south of Haulover Creek Canal and continuing south to Fabers Road) does not overlap with the typical tourism areas. All visitors should maintain an elevated level of situational awareness, exercise increased caution, and practice good safety and security practices.
Date Issued: Wed, 07 Jan 2026
There was no change to the advisory level. The “unrest” risk indicator was added. Advisory summary was updated.
Exercise Increased Caution in Benin due to unrest, crime, terrorism, and kidnapping. Some areas have increased risk. Read the entire Travel Advisory.
Do Not Travel to areas of Benin bordering Burkina Faso; Niger; and the Nigerian states of Kebbi, Niger, and Kwara due to crime, terrorism, and kidnapping.
Advisory summary
Do not travel to the border region in northern or northeastern Benin for any reason.
U.S. government employee travel restrictions
U.S. government employees working in Benin are not allowed to travel to the following areas without Ambassador approval due to safety risks:
- Alibori Department
- Atacora Department
- Borgou Department in areas north, east, and west of Parakou
- Donga Department in the area north of Djougou
- Official travel in Borgou Department north, east, and west of Parakou as well as official travel in Donga Department north of Djougou is authorized for day trips only.
- Safety risks prevent emergency consular services to U.S. citizens in the areas of Benin bordering Burkina Faso; Niger; and the Nigerian states of Kebbi, Niger, and Kwara.
- There are no safety risks in Benin that would stop the U.S. government’s ability to offer routine or emergency services, except in the identified areas of concern.
Crime
Most coastal and southern areas of Benin are safe. However, violent crime can occur in remote locations. These crimes often happen at night and include kidnapping, assault, and armed robbery.
Stay aware of your surroundings in:
- Urban areas and crowded markets.
- Areas near roadblocks, which may be manned by armed groups. Armed groups are present throughout the country.
Terrorism
There is risk of terrorist violence, including terrorist attacks and other activity in Benin. Visit the U.S. Department of State’s country reports on terrorism to learn more.
Terrorist and armed groups have attacked areas near the borders with Burkina Faso and Niger. There have also been kidnappings for ransom in areas of the Alibori and Borgou Departments near the Nigerian border.
Terrorists may target:
- Places frequented by foreigners anywhere in the country
- Popular hotels, clubs, and restaurants
- Schools
- Places of worship
- International diplomatic missions
- Local security forces
Unrest
There have been instances of military activity and civil unrest that resulted in violence in Benin. This type of violence may lead to road and land border closures as well as impacted operations at the Cotonou International Airport. Although U.S. citizens have not been targeted, sporadic military activity or civil unrest may happen suddenly and poses a risk.
Kidnapping
Kidnapping for ransom occurs in Benin. Criminal groups and terrorist organizations target both locals and foreign visitors.
Level 4 – Do Not Travel – Benin’s northern and northeastern border regions
Do Not Travel to areas of Benin bordering Burkina Faso; Niger; and the Nigerian states of Kebbi, Niger, and Kwara due to crime, terrorism, and kidnapping.
Terrorists and criminal organizations carry out attacks in northern Benin. Foreign nationals and residents are at risk of kidnapping in this region. The areas of greatest risk are:
- Pendjari and W National Parks
- Alibori Department
- Atacora Department
- The Forest of the Three Rivers
- The Oueme Superior Forest
- All areas east of Route Nationale 10 up to the Benin-Nigeria border, including the cities of Kalele, Nikki, and Segbana
If you decide to travel to Benin:
- Have a plan to leave in an emergency that does not depend on U.S. government help. Review our information on Crisis and Evacuations.
- Review our information on Terrorism, Travel to High-Risk Areas, Crime Abroad, U.S. Citizens Missing Abroad, and for Victims of Crime.
- Give your itinerary to a family member or friend.
- Develop a communication plan with family, your employer, or host organization. This helps them monitor your safety and location as you travel through high-risk areas. Specify how you’ll confirm you’re safe (text, calls, etc.), how often, and who you’ll contact first to share the information.
- Carry a copy of your passport and visa (if applicable). Leave originals in your hotel safe.
- Do not display signs of wealth, like expensive watches or jewelry.
- Do not physically resist any robbery attempt.
- Monitor local media for breaking news. Be prepared to adjust your plans.
- Keep travel documents up to date and easily accessible.
- Enroll in the Smart Traveler Enrollment Program (STEP) to get important updates and alerts from the U.S. embassy. Enrolling helps the U.S. embassy contact you or your emergency contact in an emergency.
- Review the Country Security Report for Benin.
- Visit the Centers for Disease Control and Prevention (CDC) website for the latest Travel Health Information for Benin.
- Whether you are a first time or frequent traveler, use the International Travel Checklist.
- We highly recommend that you buy travel insurance before you travel. Check with your travel insurance provider about evacuation assistance, medical insurance, and trip cancelation coverage.
Date Issued: Tue, 12 Nov 2024
Reissued after periodic review with minor edits.
Exercise normal precautions in Bermuda.
Read the country information page for additional information on travel to Bermuda.
If you decide to travel to Bermuda:
Date Issued: Mon, 20 Oct 2025
Reissued after periodic review without changes.
Exercise normal precautions in Bhutan.
Read the country information page for additional information on travel to Bhutan.
If you decide to travel to Bhutan:
Date Issued: Thu, 06 Jun 2024
Reissued after annual review.
Exercise increased caution in Bolivia due to civil unrest. Some areas have increased risk. Read the entire Travel Advisory.
Do not travel to:
- Chapare region due to crime.
Country Summary: Demonstrations, strikes, and roadblocks can occur at any time in Bolivia. Demonstrations can result in violence. Roadblocks and strikes may cut off traffic and restrict the flow of goods and services around the country. Domestic and international flights may be delayed or unexpectedly cancelled.
Read the country information page for additional information on travel to Bolivia.
If you decide to travel to Bolivia:
Chapare Region: Do Not Travel
Due to a high level of violent crime, the U.S. government is limited in its ability to provide emergency services to U.S. citizens in the Chapare region. U.S. government employees must obtain special authorization to travel there.
Visit our website for Travel to High-Risk Areas.
Date Issued: Mon, 19 Aug 2024
Reissued after periodic review without changes.
Exercise normal precautions in Bonaire.
Read the country information page for additional information on travel to Bonaire.
If you decide to travel to Bonaire:
Date Issued: Thu, 12 Dec 2024
Exercise increased caution in Bosnia and Herzegovina due to terrorism, crime, and land mines.
Country Summary: Terrorist groups continue plotting possible attacks in Bosnia and Herzegovina. Terrorists may attack with little or no warning, targeting tourist locations, transportation hubs, markets/shopping malls, local government facilities, hotels, clubs, restaurants, places of worship, parks, major sporting and cultural events, educational institutions, airports, and other public areas. Theft and other crimes of opportunity are common, especially against tourists. Violent crimes, such as robbery and murder, also occur due to the availability of firearms remaining from the war. Minefields and land mines are present throughout Bosnia and Herzegovina. While suspected hazardous areas are normally clearly marked, several people are killed or injured each year.
Read the country information page for additional information on travel to Bosnia and Herzegovina.
If you decide to travel to Bosnia and Herzegovina:
- Be aware of your surroundings and maintain situational awareness when traveling to tourist locations and crowded public venues.
- Monitor local media for breaking events and adjust your plans based on new information.
- Remain on hard-surfaced roads and stay out of abandoned buildings due to risks from land mines.
- Enroll in the Smart Traveler Enrollment Program (STEP) to receive Alerts and make it easier to locate you in an emergency.
- Follow the Department of State on Facebook and X/Twitter.
- Review the Country Security Report for Bosnia and Herzegovina.
- Visit the CDC page for the latest Travel Health Information related to your travel.
- Prepare a contingency plan for emergency situations. Review the Traveler’s Check
Date Issued: Mon, 26 Feb 2024
Updated to include information on crime.
Exercise increased caution in Botswana due to crime.
Country Summary: Crimes of opportunity, primarily the theft of money and personal property, are common in Botswana. Potentially violent crimes, such as home invasions, break-ins, “smash and grabs” from vehicles stopped at intersections and from locked cars in shopping mall parking lots, cell phone thefts, and muggings are routinely reported to police.
Read the country information page for additional information on travel to Botswana.
If you decide to travel to Botswana:
- Enroll in the Smart Traveler Enrollment Program (STEP) to receive Alerts and make it easier to locate you in an emergency.
- Do not physically resist any robbery attempt.
- Carry a copy of your passport and visa (if applicable) and leave originals in your hotel safe.
- Do not display signs of wealth, such as expensive watches or jewelry.
- Follow the Department of State on Facebook and Twitter.
- Review the Country Security Report for Botswana.
- Prepare a contingency plan for emergency situations. Review the Traveler’s Checklist.
- Visit the CDC page for the latest Travel Health Information related to your travel.
Date Issued: Thu, 29 May 2025
Updated to add risk indicator for kidnapping.
Exercise increased caution in Brazil due to crime and kidnapping. Some areas have increased risk. Read the entire Travel Advisory.
Do not travel to these areas due to crime:
- Anywhere within 160 km/100 miles of Brazil’s land borders with Bolivia, Colombia, Guyana, French Guiana, Paraguay, Peru, Suriname, and Venezuela. This restriction does not apply to the Foz do Iguacu National Park or Pantanal National Park.
- Informal housing developments, such as favelas, vilas, comunidades, or conglomerados, at any time.
- Brasilia’s “Satellite Cities” at night. This includes Ceilandia, Santa Maria, Sao Sebastiao, and Paranoa.
Country Summary: Violent crime, including murder, armed robbery, and carjacking, can occur in urban areas, day and night. There was a kidnapping for ransom of U.S. travelers. Gang activity and organized crime are widespread and often tied to the recreational drug trade. Assaults, including with sedatives and drugs placed in drinks, are common, especially in Rio de Janeiro. Criminals target foreigners through dating apps or at bars before drugging and robbing their victims. U.S. government employees are advised not to use municipal buses in Brazil because of a serious risk of robbery and assault, especially at night.
If you decide to travel to Brazil:
- Stay aware of your surroundings.
- Do not physically resist any robbery attempt.
- Do not accept food or drinks from strangers and always watch your drinks.
- Use caution when walking or driving at night.
- Avoid going to bars or nightclubs alone.
- Avoid walking on beaches after dark.
- Do not display signs of wealth, such as expensive watches or jewelry.
- Be alert to date drug scams.
- Stay alert when visiting banks or ATMs.
- Be careful at major transportation centers or on public transport, especially at night. Passengers are at higher risk of robbery or assault when using public buses in Brazil.
- Use increased caution when hiking in isolated areas.
- Develop a communication plan with family, employer, or host organization so they can monitor your safety and location as you travel through high-risk areas. Specify how you’ll confirm you’re safe (text, calls, etc.), how often, and who you’ll contact first to share the information.
- Enroll in the Smart Traveler Enrollment Program (STEP) to receive messages and alerts from the U.S. Embassy and make it easier to locate you in an emergency.
- Review the Country Security Report for Brazil.
- Prepare a plan for emergency situations. Review the Traveler’s Checklist.
- Visit the CDC page for the latest Travel Health Information related to your travel and return to the United States.
- We highly recommend that you buy insurance before you travel. Check with your travel insurance provider about evacuation assistance, medical insurance, and trip cancellation coverage.
International Borders – Level 4: Do Not Travel
Given security risks, U.S. government employees working in Brazil must obtain special authorization to travel within 160 km/100 miles of the international land borders with Bolivia, Colombia, Guyana, French Guiana, Paraguay, Peru, Suriname, and Venezuela. Travel to the Foz do Iguacu National Park and Pantanal National Park is allowed.
Do not travel to these areas for any reason.
Visit our website for Travel to High-Risk Areas.
Informal Housing Developments (commonly known as favelas, vilas, comunidades or conglomerados) – Level 4: Do Not Travel
Given crime concerns, U.S. government employees working in Brazil must obtain special authorization to travel to informal housing developments in Brazil.
Do not travel to informal housing developments, even on guided tours. Neither tour companies nor police can guarantee your safety when entering these communities. Even in areas that police or local governments deem safe, the situation can change quickly. While some informal housing developments have clear boundaries, other such areas may be less obvious, and may be identified by crowded quarters, impoverished conditions, or irregular construction. Exercise caution near these communities as gang fighting and police clashes sometimes move beyond the confines of these areas.
Check the Safety and Security Section on the country information page and consult the maps on the Embassy’s website for details about favelas.
Do not travel to these areas for any reason.
Visit our website for Travel High-Risk Areas.
Brasilia’s “Satellite Cities” – Level 4: Do Not Travel
Given crime risks, U.S. government employees working in Brazil must obtain special authorization to travel to Brasilia’s Administrative Regions of Ceilandia, Santa Maria, Sao Sebastiao, and Paranoa between 6:00 p.m. and 6:00 a.m.
Do not travel to these areas for any reason.
Visit our website for Travel to High-Risk Areas.
Date Issued: Thu, 22 Aug 2024
Reissued after periodic review with minor edits.
Exercise normal precautions in the British Virgin Islands.
Read the country information page for additional information on travel to the British Virgin Islands.
If you decide to travel to the British Virgin Islands:
Date Issued: Wed, 19 Mar 2025
Reissued after periodic review with minor edits.
Exercise normal precautions in Brunei.
Read the country information page for additional information on travel to Brunei.
If you decide to travel to Brunei:
Date Issued: Thu, 09 Oct 2025
There were no changes to the advisory level or risk indicators. Advisory summary was updated.
Advisory Sumary
Exercise normal precautions in Bulgaria.
If you decide to travel to Bulgaria:
Date Issued: Wed, 16 Apr 2025
Updated to reflect changes for travelers with dual nationality
Do not travel to Burkina Faso for any reason due to terrorism, crime, and kidnapping.
Country Summary: Terrorist organizations continue to plan and conduct terrorist activities throughout Burkina Faso.
Terrorism
Terrorists may attack anywhere with little or no warning and may utilize various tactics including the use of common, commercially available items or the use of kidnapping for ransom. Targets may include but are not limited to:
- Hotels
- Restaurants
- Police stations
- Customs offices
- Areas at or near mining sites
- Places of worship
- Military posts
- Schools
Visit the U.S. Department of State’s Country Reports on Terrorism to learn more.
The threat of kidnapping remains persistent throughout Burkina Faso, including in Ouagadougou and especially in the Sahel and East regions.
State of Emergency
The Transition Authorities of Burkina Faso have maintained a state of emergency in the following territories:
- The entire Saheland East regions
- The provinces of Kossi and Sourou (Boucle de Mouhoun region)
- The province of Kenedougou (Hauts Bassins region)
- The province of Loroum (North region)
- The province of Koulpelogo (Center-East region)
Due to the risks, the U.S. government is unable to provide emergency services to U.S. citizens in most of the country. U.S. government employees working in Burkina Faso are prohibited from traveling to regions outside the capital due to security concerns.
Due to a historically high crime rate, the U.S. Embassy discourages U.S. government personnel from nighttime travel to the Balkiui and Rayongo (also known as Dayongo) neighborhoods of Ouagadougou’s Arrondissement 11.
For travelers with dual nationality, local authorities may not recognize your U.S. nationality if you are also a national of Burkina Faso. Read the dual-nationality-traveler page for additional information about traveling with a dual nationality.
Read the country information page for additional information on travel to Burkina Faso.
If you decide to travel to Burkina Faso:
- Visit our website for Travel to High-Risk Areas.
- Have evacuation plans that do not rely on U.S. government assistance.
- Take steps to lower your risk of becoming a victim of violence, including limiting trips to places frequented by tourists.
- Do not physically resist any robbery attempt.
- Review your personal security plans.
- Remain aware of your surroundings and local events.
- Draft a will and designate appropriate insurance beneficiaries and/or power of attorney.
- Enroll in the Smart Traveler Enrollment Program (STEP) to receive Alerts and make it easier to locate you in an emergency.
- Review the Country Security Report for Burkina Faso.
- Prepare a backup plan for emergency situations. Review the Traveler’s Checklist.
- Visit the CDC page for the latest Travel Health Information related to your travel.
Date Issued: Mon, 12 May 2025
Updated to reflect changes to risk indicators, restrictions on U.S. government personnel, and the “If you decide to travel to Burma” section.
Do not travel to Burma due to armed conflict, the potential for civil unrest, arbitrary enforcement of local laws, poor health infrastructure, land mines and unexploded ordnance, crime, and wrongful detentions.
Country Summary: The Burma military regime deposed elected leaders and officials in a February 2021 coup d’état. Protests and demonstrations against military rule can occur on significant dates. The military has responded to those protests with violence and by arbitrarily detaining protesters and bystanders.
The Department has determined that U.S. nationals are at significant risk of wrongful detention by military regime authorities. Wrongfully detained U.S. nationals have been held in prison for years, often in poor conditions and without fair and transparent treatment or consistent access to U.S. Embassy officials or their families.
Due to the unpredictable nature of ongoing armed conflict and potential civil unrest in Burma, U.S. government employees working in Burma may be prohibited from traveling within the country.
Due to the risks in the country, dependents under the age of 21 cannot accompany U.S. government employees who work in Burma.
Armed conflicts occur throughout Burma, and the potential for civil unrest is high. The level of armed conflict and civil unrest varies significantly between and within states and regions and may change at any time.
Attacks by opposition militia on locations connected to the military and security authorities regularly occur in Rangoon and many other parts of the country. Local opposition militia groups actively operate around the country. Travelers are cautioned of the potential for the regime to limit access to highways and airports, causing an isolating situation.
Improvised explosive devices (IEDs) are used in the ongoing armed conflicts, including within the greater Rangoon area. From January to December 2024, the U.S. Embassy in Rangoon calculated an average of 21 explosions per month detonated against regime personnel and facilities in Rangoon. Outside of Rangoon, there have been IED attacks against checkpoints and military, administrative, and police facilities.
Land mines and unexploded ordnance (UXO) exist throughout Burma, and their locations are often not marked or otherwise unidentifiable. The military regime will often arbitrarily enforce local laws, including detaining individuals without fair and transparent treatment. Foreigners, including U.S. citizens, are not excluded from this practice. U.S. citizens traveling or residing in Burma may be detained, and regime authorities could deny a prisoner access to U.S. consular services or information about the alleged crime.
Local law enforcement officials may also detain and/or deport U.S. citizens for speaking out or protesting against the military regime, including on their personal social media accounts, and for sending private electronic messages critical of the military regime, regardless of whether they were physically in Burma when they did so.
Burma has limited and/or inadequate healthcare and emergency medical resources.
As of April 2024, the Burma military regime began implementing a military conscription law for males up to age 45 and females up to age 35. The military regime may prevent departure of people they view as eligible for conscription, including U.S. citizens who previously held Burmese nationality, and force them into the military.
Crime in Burma has been increasing. Violent crime against foreigners is rare, but there have been incidents involving attacks by taxi drivers and muggings. People are advised to take particular care when taking taxis late at night.
Foreign nationals, including U.S. citizens, have been trafficked into Burma and forced to work in internet scam centers, often located in active conflict zones along Burma’s eastern borders. These victims often respond to ads promising jobs in Thailand and are then forced or unwittingly lured into working at scam centers in Burma.
Read the Country Information page for additional information on travel to Burma.
If you decide to travel to Burma:
- Enroll in the Smart Traveler Enrollment Program (STEP) to receive Alerts and make it easier to locate you in an emergency.
- Follow the Embassy’s Consular Section on Facebook.
- Review the Country Security Report for Burma.
- Visit the CDC page for the latest Travel Health Information related to your travel and return to the United States.
- We highly recommend that you buy insurance before you travel. Check with your travel insurance provider about evacuation assistance, medical insurance, and trip cancellation coverage.
- Stay aware of your surroundings and avoid demonstrations and crowds.
- Avoid traveling off well-used roads, tracks, and paths, and do not touch unknown metal objects due to risk of unexploded ordnance.
- Keep travel documents up to date and easily accessible.
- Make back up plans to leave the country on short notice should conditions warrant, including evacuation plans that do not rely on U.S. government assistance.
- Review local laws and conditions before traveling.
- Review our website on Dual-Nationality.
- Visit our website for High-Risk Area Travelers.
- Share important documents, login information, and points of contact with loved ones. This is so that they can manage your affairs if you are unable to return as planned to the United States. Review this list of documents to prepare for your trip.
- Develop a communication plan with family and/or your employer or host organization.
- Erase any sensitive photos, comments, or other materials that could be considered controversial or provocative by local groups from your social media pages, cameras, laptops, and other electronic devices prior to travel.
Date Issued: Tue, 29 Apr 2025
Updated to reflect the end of ordered departure of eligible family members and authorized departure for non-emergency employees and updates to U.S. government employee movement restrictions.
Reconsider travel to Burundi due to political violence, crime, and health. Some areas have increased risk. Read the entire Travel Advisory.
Do Not Travel to:
- The former Central Market located on Chaussee Prince Louis Rwagasore in Bujumbura due to the risk of violent crime.
- Cibitoke and Bubanza provinces and Kibira National Park due to potential armed violence.
Country Summary: The possibility for political violence exists throughout Burundi. Police and military checkpoints are common and can limit movement. Police may search private homes for weapons. The borders may close without notice.
Violent crimes like assault, carjacking, home invasion, grenade attacks, and armed robbery are possible. Criminals may target foreigners and residents suspected of having large sums of cash. Local police lack the resources and training to respond effectively to crimes.
Medical services in Burundi fall well below U.S. standards, and there are no adequate trauma services in the country. Emergency medical and fire services are limited or non-existent in some areas of the country. Even relatively minor health problems may necessitate a medical evacuation at the traveler’s expense. Medical evacuation insurance valid for travel to Burundi is strongly recommended.
Due to the risks, the U.S. government has limited ability to provide emergency services to U.S. citizens throughout Burundi. U.S. Embassy staff are subject to restrictions when traveling in certain areas of Burundi and may be subject to other constraints as security conditions warrant. U.S. government employees working in Burundi are prohibited from travelling outside Bujumbura Mairie during hours of darkness (typically 6:00 p.m. to 6:00 a.m.).
Due to the risks, the U.S. government may be unable to provide emergency services to U.S. citizens in the following areas:
- The provinces of Bubanza.
- Cibitoke and Kibira National Park (including the park’s southernmost part in Muramvya province).
Read the country information page for additional information on travel to Burundi.
If you decide to travel to Burundi:
- Enroll in the Smart Traveler Enrollment Program (STEP) to receive Alerts and make it easier to locate you in an emergency.
- Review the Country Security Report for Burundi.
- Visit our website for Travel to High-Risk Areas.
- Bring a sufficient supply of over-the-counter and prescription medicines.
- We highly recommend that you buy insurance before you travel.
- Check with your travel insurance provider about evacuation
- assistance, medical insurance, and trip cancellation coverage.
- Visit the CDC page for the latest Travel Health Information related to your travel and return to the United States
- Avoid areas where there are large gatherings, protests, or demonstrations, and exercise caution in the vicinity of any such gatherings.
- Remain aware of your surroundings and be vigilant when traveling in unfamiliar areas or outside of cities and along border areas; take appropriate steps to enhance your personal security.
- Prepare contingency plans for emergency situations. Review the Traveler’s Checklist.
- Consider traveling in pairs and using convoys of multiple vehicles to mitigate the risks related to traveling outside of Bujumbura. Carry additional fuel, spare tires, and provisions. Include a map, navigation equipment, and first aid kit. Service stations are scarce in rural areas. Professional roadside assistance service is not available outside the capital.
- Follow the Department of State on Facebook and X/Twitter.
The former Central Market located on Chaussee Prince Louis Rwagasore – Level 4: Do Not Travel
Violent crimes, such as grenade attacks and armed robbery, can occur.
The former Central Market located on Chaussee Prince Louis Rwagasore is off-limits to U.S. Embassy personnel at all times.
Visit our website for Travel to High-Risk Areas.
Cibitoke and Bubanza provinces and Kibira National Park – Level 4: Do Not Travel
Armed persons and groups exploit porous borders and forested areas between Burundi, Rwanda, and the Democratic Republic of the Congo for movement and activities. U.S. government employees working in Burundi are restricted from travel to the following areas without special permission: the provinces of Bubanza and Cibitoke and Kibira National Park (including the park’s southernmost part in Muramvya province).
Due to travel restrictions on U.S. Embassy personnel, the U.S. government may be unable to provide emergency services to U.S. citizens in these areas.
Visit our website for Travel to High-Risk Areas.
Date Issued: Thu, 18 Dec 2025
Exercise normal precaution in Cabo Verde due to crime.
Cabo Verde is generally a safe destination for travelers. Some areas have increased risk.
Date Issued: Fri, 25 Jul 2025
The advisory level was increased to 2. The “unrest” risk indicator was added. An area of increased risk was added. The advisory summary was updated.
Exercise increased caution in Cambodia due to crime and landmines. Some areas have increased risks. Read the entire Travel Advisory.
Do Not Travel to:
- Areas along Cambodian and Thai border due to armed conflict.
Advisory summary:
Phnom Penh
Street crime, particularly phone and bag snatchings, occurs frequently in areas where foreigners gather; resistance can result in injury. Violent crimes, such as sexual assault and homicide do occur and sometimes are committed against foreigners.
Battambang, Banteay Meanchey, Pursat, Siem Reap, Pailin, and Kampong Thom provinces
Landmines and unexploded ordnance are found in remote areas throughout Cambodia, and especially in Battambang, Banteay Meanchey, Pursat, Siem Reap, Pailin, and Kampong Thom provinces.
Do not touch unknown metal objects; instead notify the Cambodia Mine Action Center at 012-800-473/023-995-437. Use a local guide when walking in forested areas or dry rice paddies in these areas.
Level 4: Do Not Travel
Cambodia – Thailand Border
Do not travel to areas within 50km of the Cambodia – Thailand border due to ongoing fighting between Cambodian and Thai military forces.
There are reports of fighting, including rocket and artillery fire, between Cambodian and Thai forces along the border. Armed conflict has led to reports of civilian casualties. There is a collateral risk of violence, and U.S. citizens are advised to avoid all but essential travel to within 50km of these border areas until further notice. The U.S. government has limited ability to provide emergency services to U.S. citizens in these provinces due to the ongoing risk of armed conflict.
Read the destination information page for additional information on travel to Cambodia.
If you decide to travel to Cambodia:
- Do not physically resist any robbery attempt.
- Have evacuation plans that do not rely on U.S. government assistance.
- Enroll in the Smart Traveler Enrollment Program (STEP) to get important updates and alerts from the U.S. embassy or consulate. Enrolling helps the U.S. embassy or consulate contact you or your emergency contact in an emergency.
- Review the Country Security Report for Cambodia.
- Prepare a contingency plan for emergency situations. Review the Traveler’s Checklist.
- Visit the CDC page for the latest Travel Health Information related to your travel.
- We highly recommend that you buy insurance before you travel. Check with your travel insurance provider about evacuation assistance, medical insurance, and trip cancellation coverage.
Date Issued: Wed, 18 Dec 2024
Updated to reflect the addition of health and civil unrest indicators.
Exercise increased caution in Cameroon due to armed violence, civil unrest, crime, health, kidnapping, and terrorism. Some areas have increased risk. Read the entire Travel Advisory.
Do Not Travel to:
- Northwest and Southwest Regions due to armed violence, crime, and kidnapping.
- North Region and parts of East and Adamawa Regions due to crime and kidnapping.
- Far North Region due to crime, kidnapping, and terrorism.
Country Summary: Violent crime, kidnapping for ransom, armed robbery, and carjacking, is common throughout Cameroon, especially in the regions listed above. Local police lack the resources to respond effectively to serious criminal incidents.
Civil unrest is common, with the potential for political violence.
Access to health care is limited.
The U.S. government has limited ability to provide emergency services to U.S. citizens in North, Far North, Northwest, Southwest, and parts of Adamawa and East Regions of Cameroon due to current official travel restrictions..
Read the Country Information Page for additional information on travel to Cameroon.
If you decide to travel to Cameroon:
- Do not display signs of wealth, such as expensive watches, handbags, or jewelry.
- Monitor local media for breaking events and be prepared to adjust your plans.
- Enroll in the Smart Traveler Enrollment Program (STEP) to receive important information from the Embassy about safety conditions in your destination country, help the Embassy contact you in an emergency, and help family and friends get in touch with you in an emergency.
- Follow the Department of State on Facebook and X/Twitter.
- Review the Country Security Report for Cameroon.
- Prepare a contingency plan for emergency situations. Review the Traveler’s Checklist.
- Visit the CDC page for the latest Travel Health Information related to your travel.
North, Far North, Northwest, and Southwest Regions, and parts of East and Adamawa Regions – Level 4: Do Not Travel
Violent crime, including kidnapping for ransom, armed robbery, assault, and carjacking is a serious concern in Cameroon, especially in these areas.
In the Adamawa Region north of the capital, Ngaoundere, and East Region, there is a heightened criminal threat within 20 kilometers of the border with the Central African Republic.
Visit our website for Travel to High-Risk Areas.
Far North Region– Level 4: Do Not Travel
In the Far North Region, terrorists may attack with no warning, targeting local facilities and places frequented by Westerners.
Visit our website for Travel to High-Risk Areas.
Northwest and Southwest Regions – Level 4: Do Not Travel
In Northwest and Southwest Regions, armed clashes between separatists and government forces, and other acts of violence, including violent criminality, kidnapping for ransom, sexual assault, arson, roadside ambushes and robberies, use of improvised explosive devices, illegitimate detentions, and murder have occurred. Security force operations, curfews and movement restrictions, and attacks by armed militants can take place at any time throughout these regions, including in urban areas. Ongoing violence has led to a breakdown in order and a significant decline in public services, including medical resources in large areas of both regions.
Visit our website for Travel to High-Risk Areas.
Date Issued: Wed, 11 Jun 2025
Reissued after periodic review with minor edits.
Exercise normal precautions in Canada.
Advisory summary: Canada is generally a safe destination for travelers.
Read the country information page for additional information on travel to Canada.
U.S. citizens should always exercise caution when traveling abroad. Use these general tips to stay safe:
Date Issued: Wed, 04 Sep 2024
Reissued after periodic review with minor edits.
Exercise normal precautions in the Cayman Islands.
Read the country information page for additional information on travel to the Cayman
If you decide to travel to the Cayman Islands:
Date Issued: Thu, 15 Jan 2026
Do not travel to Central African Republic due to risk of unrest, crime, kidnapping, landmines, health, and terrorism.
The U.S. government has limited ability to provide emergency services to U.S. citizens in the Central African Republic.
- U.S. government employees working in the Central African Republic must get special authorization to travel outside of Bangui. They are required to travel in armored vehicles in Bangui and are subject to a curfew.
- Family members cannot join U.S. government employees who work in the Central African Republic.
There is a continuing risk of civil unrest, demonstrations, and election-related violence. This includes renewed outbreaks of armed conflict occurring throughout the country.
- Unrest can happen in the capital of Bangui.
- Armed groups and opposition forces control large areas of the country. They regularly kidnap, injure, or kill civilians.
- Airport, land border crossings, and road closures may occur without warning.
Violent crime is common. It includes homicide, kidnapping, armed robbery, aggravated battery, and larceny.
Criminal gangs and armed groups kidnap for ransom on a frequent basis, mainly outside of Bangui. Local law enforcement officials are not equipped or trained to handle the threat of kidnapping.
Unexploded landmines are unmarked. They are a known risk. Landmines may be present anywhere outside Bangui, particularly:
- Along the border with Cameroon
- In the tri-border region with Chad in Sector West
- Near Bambari in Sector East
Medical services in the Central African Republic are extremely limited. There is no adequate medical treatment available for routine and emergency procedures. Even minor health issues could require medical evacuation at your expense.
- Make sure you know if your health insurance plan covers any medical expenses coverage abroad. Most U.S. plans do not.
- If you purchase medical travel insurance, you are responsible for seeking reimbursement from your medical insurance. Be sure to follow their guidance and instructions for filing claims.
- We strongly recommend supplemental insurance to cover medical evacuation.
Make sure you are up to date on all routine vaccines before every trip. Travelers are required to show proof of yellow fever vaccination for all arriving travelers (at least 9 months old). CDC recommends that travelers going to the Central African Republic take prescription medicine to prevent malaria.
Stay up to date with the vaccines recommended by the U.S. Centers for Disease Control and Prevention:
Ineffective border controls may allow criminal and terrorist groups to seek temporary refuge in the Central African Republic. Be alert to your surroundings. Terrorists can attack without warning. They may target foreign and local government facilities as well as tourist areas.
Date Issued: Tue, 18 Mar 2025
Updated to reflect additional information about violent crime and travel to border areas.
Reconsider travel to Chad due to crime, terrorism, civil unrest, and kidnapping. Some areas have increased risk. Read the entire Travel Advisory.
Do Not Travel to:
- Lake Chad region due to terrorism.
- Borders with Cameroon, Central African Republic, Libya, Niger, Nigeria, and Sudan due to armed conflict and minefields
Country Summary: Violent crime such as armed robbery, carjacking, kidnapping, rape, homicide, and muggings, occur in Chad.
Terrorists may attack with little or no warning, targeting foreigners, local security forces, and civilians.
Demonstrations occur sporadically and have on occasion resulted in violence or use of tear gas by authorities. Outside of N’Djamena, the U.S. Government has extremely limited ability to provide emergency services to U.S. citizens in Chad. Due to risks, U.S. Government employees working in Chad must obtain special authorization to travel outside of the capital.Read the country information page for additional information on travel to Chad.
If you decide to travel to Chad:
- Visit our website for Travel to High-Risk Areas.
- Check local media for breaking events. Be prepared to adjust your plans.
- Do not physically resist any robbery attempt.
- Be aware of your surroundings.
- Keep travel documents up to date and easily accessible.
- Have evacuation plans that do not rely on U.S. government assistance.
- Develop a communication plan with family or your employer or host organization. This is so that they can monitor your safety and location as you travel through high-risk areas. Specify how you’ll confirm you’re safe (text, calls, etc.), how often, and who you’ll contact first to share the information.
- Enroll in the Smart Traveler Enrollment Program (STEP) to receive Alerts and make it easier to locate you in an emergency.
- Prepare a backup plan for emergency situations. Review the Traveler’s Checklist.
- Visit the CDC page for the latest Travel Health Information related to your travel and return to the United States.
- We highly recommend that you buy insurance before you travel. Check with your travel insurance provider about evacuation assistance, medical insurance, and trip cancellation coverage.
Lake Chad Region – Level 4: Do Not Travel
Terrorists and armed non-governmental groups may attack with little or no warning. They target foreigners, local security forces, and civilians. Terrorists and armed non-governmental groups can easily cross borders. Government security forces may restrict civilian movement and engage in military operations with limited warning. Do not travel to this area for any reason.
Outside of N’Djamena, the U.S. Government has extremely limited ability to provide emergency services to U.S. citizens in Chad including the Lake Chad Basin.
Visit our website for Travel to High-Risk Areas.
Borders of Cameroon, Central African Republic, Libya, Niger, Nigeria, and Sudan – Level 4: Do Not Travel
Armed non-governmental groups operate along Chad’s borders with Cameroon, Central African Republic, Niger, Nigeria, Sudan, and in Libya and northern Chad. Do not travel to this area for any reason.
There are unmapped and undocumented minefields along the borders with both Libya and Sudan.
Outside of N’Djamena, the U.S. Government has extremely limited ability to provide emergency services to U.S. citizens in Chad, particularly in border areas.
Visit our website for Travel to High-Risk Areas.
Date Issued: Thu, 16 Jan 2025
Exercise increased caution in Chile due to crime and civil unrest.
Country Summary: Street crime (e.g., muggings, pick-pocketing, theft) is common in Chile. Rates of violent crime, such as assaults, homicide, carjackings, and residential break-ins, are increasing.
Large-scale demonstrations periodically occur in Santiago and other cities in Chile. Demonstrations can take place with little or no notice, and often result in disruptions to transportation, including public bus and Santiago metro services.Read the country information page for additional information on travel to Chile.
If you decide to travel to Chile:
- Do not leave luggage unattended, even in locked vehicles.
- Always carry a copy of your U.S. passport and visa (if applicable). Keep original documents in a secure location.
- Avoid demonstrations.
- Follow the instructions of local authorities including movement restrictions and obey all curfews.
- Find a safe location and shelter in place if in the vicinity of large gatherings or protests.
- Review the Country Security Report for Chile.
- Enroll in the Smart Traveler Enrollment Program (STEP) to receive Alerts and make it easier to locate you in an emergency.
- Follow the U.S. Embassy and Department of State on Facebook, Instagram, and X/Twitter.
- Prepare a contingency plan for emergency situations. Review the Traveler’s Checklist.
- Visit the CDC page for the latest Travel Health Information related to your travel.
Date Issued: Wed, 27 Nov 2024
Exercise increased caution traveling to Mainland China due to arbitrary enforcement of local laws, including in relation to exit bans.
Summary: The People’s Republic of China (PRC) government arbitrarily enforces local laws, including exit bans on U.S. citizens and citizens of other countries, without fair and transparent process under the law.
Foreigners in the PRC, including but not limited to businesspeople, former foreign-government personnel, academics, relatives of PRC citizens involved in legal disputes, and journalists have been interrogated and detained by PRC officials for alleged violations of PRC national security laws. The PRC has also interrogated, detained, and expelled U.S. citizens living and working in the PRC.
U.S. citizens traveling or residing in the PRC may be detained without access to U.S. consular services or information about their alleged crime. U.S. citizens in the PRC may be subjected to interrogations and detention without fair and transparent treatment under the law.
PRC authorities have broad discretion to deem a wide range of documents, data, statistics, or materials as state secrets and to detain and prosecute foreign nationals for alleged espionage. There is increased official scrutiny of U.S. and third-country firms, such as professional service and due diligence companies, operating in the PRC. Security personnel could detain U.S. citizens or subject them to prosecution for conducting research or accessing publicly available material inside the PRC.
Security personnel could detain and/or deport U.S. citizens for sending private electronic messages critical of the PRC, Hong Kong SAR, or Macau SAR governments.
In addition, the PRC government has used restrictions on travel or departure from the PRC, or so-called exit bans, to:
- compel individuals to participate in PRC government investigations;
- pressure family members of the restricted individual to return to the PRC from abroad;
- resolve civil disputes in favor of PRC citizens; and
- gain bargaining leverage over foreign governments.
U.S. citizens might only become aware of an exit ban when they attempt to depart the PRC, and there may be no available legal process to contest an exit ban in a court of law. Relatives, including minor children, of those under investigation in the PRC may become subject to an exit ban.
The PRC government does not recognize dual nationality. Dual U.S.-PRC citizens and U.S. citizens of Chinese descent may be subject to additional scrutiny and harassment. If you are a U.S. citizen and choose to enter Mainland China on travel documents other than a U.S. passport and are detained or arrested, the PRC government may not notify the U.S. Embassy or the U.S. Consulates General or allow consular access.
Check with the PRC Embassy in the United States for the most updated information on travel to the PRC. In some limited circumstances travelers to Mainland China may face additional COVID-19 testing requirements to enter some facilities or events.
The Department of State does not provide or coordinate direct medical care to private U.S. citizens abroad. U.S. citizens overseas may receive PRC-approved COVID-19 vaccine doses where they are eligible.
Do not consume drugs in the PRC or elsewhere prior to arriving in the PRC. A positive drug test, even if the drug was legal elsewhere, can lead to immediate detention, fines, deportation, and/or a ban from re-entering the PRC. PRC authorities may compel cooperation with blood, urine, or hair testing. Penalties for drug offenses may exceed penalties imposed in the United States.
Demonstrations: Participating in demonstrations or other activities that authorities interpret as constituting an act of secession, subversion, terrorism, or collusion with a foreign country could result in criminal charges. Be aware of your surroundings and avoid demonstrations.
XINJIANG UYGHUR AUTONOMOUS REGION, TIBET AUTONOMOUS REGION, and TIBETAN AUTONOMOUS PREFECTURES
Extra security measures, such as security checks and increased levels of police presence and surveillance, are common in the Xinjiang Uyghur Autonomous Region, Tibet Autonomous Region, and Tibetan Autonomous Prefectures. Authorities may impose curfews and travel restrictions on short notice.
If you decide to travel to Mainland China:
- Enter the PRC on your U.S. passport with a valid PRC visa and keep it with you.
- Read the travel information page for Mainland China.
- Enroll in the Smart Traveler Enrollment Program (STEP) to receive alerts and make it easier to locate you in an emergency.
- Be aware of your surroundings.
- Avoid demonstrations.
- Exercise caution in the vicinity of large gatherings or protests.
- Avoid taking photographs of protesters or police without permission.
- Keep a low profile.
- If you are arrested or detained, ask police or prison officials to notify U.S. Embassy Beijing or the nearest U.S. Consulate General immediately.
- Review the China Country Security Report from the Overseas Security Advisory Council.
- Do not consume drugs in the PRC or prior to arriving in the PRC.
- Follow the Department of State on Facebook and Twitter. Follow U.S. Embassy Beijing on Twitter, WeChat, and Weibo.
- Visit the Centers for Disease Control and Prevention (CDC) page for the latest Travel Health Information related to the PRC.
- Prepare a contingency plan for emergency situations.
- Review the Traveler’s Checklist.
- Do not travel to the Democratic People’s Republic of Korea (DPRK). U.S. passports are not valid for travel to, in, or through the DPRK, unless they are specially validated by the Department of State.
Date Issued: Thu, 17 Apr 2025
Updated information on civil unrest and kidnapping.
Reconsider travel to Colombia due to crime, terrorism, civil unrest, and kidnapping. Some areas have an increased risk. Read the entire Travel Advisory.
Do Not Travel to:
- Arauca, Cauca (excluding Popayán), and Norte de Santander departments due to crime and terrorism.
- The Colombia-Venezuela border region due to crime, kidnapping, conflict between armed groups, and the risk of detention.
Country Summary: Violent crime, like murder, assault, and robbery, is common in many areas in Colombia. In some places, organized crime is rampant. This includes extortion, robbery, and kidnapping.
There is risk of terrorist violence, including terrorist attacks and other activity, in Colombia. Visit the U.S. Department of State’s country reports on terrorism to learn more.
Terrorists and criminal organizations in Colombia may attack with little or no warning and target:
- U.S. government facilities
- Local government facilities
- Tourist areas and attractions
- Transportation centers
- Shopping malls and markets
- Military and police facilities
- Hotels
- Clubs
- Restaurants
- Airports
Political demonstrations are common throughout Colombia and can:
- Shut down roads and highways without notice or estimated reopening timelines.
- Lead to road closures that reduce access to public transportation.
- Interrupt travel within and between cities.
- Become violent and result in deaths and injuries.
Due to the risks, U.S. government employees working in Colombia are prohibited from:
- Going to Colombia’s land borders with neighboring countries without special authorization.
- Using motorcycles.
- Using street taxis or any public transportation that is not prearranged.
Read the country information page for additional information on travel to Colombia.
If you decide to travel to Colombia:
- Visit our website for Travel to High-Risk Areas.
- Avoid demonstrations and crowds.
- Check local media for breaking news. Be prepared to adjust your plans.
- Keep a low profile.
- Do not display signs of wealth, such as expensive watches or jewelry.
- Stay aware of your surroundings.
- Travel only during daylight hours.
- Enroll in the Smart Traveler Enrollment Program (STEP) to receive messages and Alerts from the U.S. Embassy and make it easier to locate you in an emergency.
- Review the Country Security Report for Colombia.
- Prepare a plan for emergency situations. Review the Traveler’s Checklist.
- Visit the CDC page for the latest Travel Health Information related to your travel and return to the United States.
- We highly recommend that you buy insurance before you travel. Check with your travel insurance provider about evacuation assistance, medical insurance, and trip cancellation coverage.
Arauca, Cauca (excluding Popayán), and Norte de Santander departments – Level 4: Do Not Travel
Do not travel to these areas for any reason. Violent crime, like armed robbery and murder, is common in these locations. Terrorist groups are active in some areas here.
- Due to the risks, U.S. government employees working in Colombia are prohibited from traveling to these areas.
The Colombia-Venezuela border region – Level 4: Do Not Travel
Do not travel to this area for any reason. Crime, kidnapping, and armed conflict are common here. Do not cross the border into Venezuela from Colombia. You may be detained by Venezuelan authorities.
- Due to the risks, the U.S. government has limited ability to provide emergency services to U.S. citizens here.
- Due to the risks, U.S. government employees working in Colombia are prohibited from traveling to this region.
- The Colombia-Venezuela border is not clearly marked. Avoid the area due to the risk of accidentally crossing into Venezuela.
- Venezuela’s Travel Advisory is Level 4: Do Not Travel. U.S. citizens trying to enter Venezuela without a visa have faced terrorism charges. They have been held for long periods.
- For more information, read the Venezuela Travel Advisory.
Date Issued: Mon, 12 Jan 2026
Exercise increased caution in Comoros due to crime, unrest, and health.
There is no full-time official U.S. presence in Comoros. Consular services for U.S. citizens in Comoros are provided by the U.S. embassy in Madagascar.
Crime
Petty crime is common in Comoros. Stay aware of your surroundings. Comoros has also had reports of piracy. Small crafts on the open seas are vulnerable to attack.
Unrest – demonstrations
Protests occur spontaneously in Comoros and can happen due to political factors. Most protests occur in Moroni, and some have turned violent. Protesters have also engaged in the destruction of property.
Health
Healthcare, including ambulance services, is limited in Moroni. It is very limited in rural areas. Medical care in rural areas often requires transportation to Moroni. Medical evacuation from Comoros is often needed for significant injuries and illnesses.
Review our information on Health in the Travel Guidance section
Date Issued: Tue, 10 Dec 2024
Exercise increased caution in Costa Rica due to crime.
Country Summary: Petty crime is common throughout Costa Rica. Violent crime, including armed robbery, homicide, and sexual assault, also affects tourists.
Read the country information page for additional information on travel to Costa Rica.
If you decide to travel to Costa Rica:
Date Issued: Mon, 08 Apr 2024
Updated to reflect safety and security information on the Northern Border Region, and additional points for mariners who decide to travel to Côte d’Ivoire.
Exercise increased caution due to crime, terrorism, civil unrest, health, and piracy. Some areas have increased risk. Read the entire Travel Advisory.
Do Not Travel To:
- Northern border region due to terrorism.
Country Summary: Crime continues to be a major public security concern in Côte d’Ivoire. Violent crime, such as carjacking, robbery, and home invasion, is common in some areas. Local police often lack resources to respond to serious crimes.
Violent extremist activity occurs in Burkina Faso and Mali near the border with Côte d’Ivoire. Terrorism concerns in the northern region remain due to its proximity to these countries.
Travelers should avoid demonstrations, protests, political rallies, and large crowds. These events can become violent. Demonstrators and security forces may clash suddenly. Police may use tear gas or other force to break up crowds.
Piracy with armed robbery and kidnapping for ransom are significant threats to ships operating near Côte d’Ivoire. U.S. citizens on ships in the Gulf of Guinea off the coast of West Africa should be cautious.
Health care in rural areas is below U.S. standards. There are often shortages of medicine and medical supplies in public and private health facilities.
The U.S. government is limited in its ability to provide emergency assistance to U.S. citizens outside Abidjan. U.S. Embassy staff are not permitted to drive outside major cities at night. Read the country information page for more information on travel to Côte d’Ivoire.
If you decide to travel to Côte d’Ivoire:
- Check local media for breaking events and adjust your plans.
- Do not physically resist any robbery attempt.
- Use caution when walking or driving at night.
- Keep a low profile.
- Be aware of your surroundings.
- Do not display signs of wealth, such as expensive watches or jewelry.
- Stay alert in locations frequented by foreign travelers and foreign residents.
- Be extra vigilant when visiting banks or ATMs.
- Carry a copy of your passport and visa (if applicable). Leave originals in your hotel safe.
- Have evacuation plans that do not rely on U.S. government help.
- Avoid demonstrations and crowds.
- Get full medical insurance. It should include medical evacuation.
- Mariners should check for U.S. maritime advisories and alerts, U.S. Coast Guard homeport website, and NGA broadcast warnings.
- Enroll in the Smart Traveler Enrollment Program (STEP). You will get safety alerts by email/text and it will help us find you in an emergency.
- Follow the Department of State on Facebook and Twitter.
- Review the Country Security Report for Côte d’Ivoire.
- Prepare a contingency plan for emergency situations. Review the Traveler’s Checklist.
- Visit the CDC page for the latest Travel Health Information related to your travel.
Northern Border Region – Level 4: Do Not Travel
The main terrorist threat to Côte d’Ivoire is from a group called Jama’at Nusrat al-Islam wal-Muslimin (JNIM). JNIM is linked to al-Qa’ida. JNIM mostly operates in the Sahel region, including Burkina Faso and Mali. The threat from JNIM has in the past reached northern Côte d’Ivoire, near the border with Burkina Faso. Attacks have happened in the Savanes and Zanzan Districts, including Comoé National Park. These attacks have mainly targeted Ivoirian security forces, but civilians have also been targeted. In 2021, Al-Qa’ida in the Lands of the Islamic Maghreb (AQIM) carried out 17 small-scale attacks that killed approximately 20 people. After these attacks, the Côte d’Ivoire government increased security in northern Côte d’Ivoire. Since 2021, there have been no attacks.
Date Issued: Thu, 09 Oct 2025
There were no changes to the advisory level. An area of increased risk was added. Advisory summary was updated.
Advisory Summary
Exercise normal precautions in Croatia. Some areas have increased risk. Read the entire Travel Advisory.
Level 2: Exercise Increased Caution
Karlovac and Lika-Senj counties
Exercise increased caution in Karlovac and Lika-Senj counties due to landmines.
- According to the Croatian government, about 24.5 square kilometers in Croatia could have landmines. These areas are in mostly dense forests and rough terrain.
- Warning signs mark areas at risk with the international landmine symbol. This symbol features a skull and crossbones in a red, upside-down triangle.
- The government of Croatia expects the country to be completely demined by the end of 2026.
If you decide to travel to Croatia:
Date Issued: Wed, 07 May 2025
Updated to reflect information on power grid failures and Department of the Treasury Office of Foreign Assets Control (OFAC) licenses for travel.
Exercise increased caution in Cuba due to crime and unreliable electrical power.
Country Summary: Petty crime is a risk for travelers in Cuba. This includes pick pocketing, purse snatchings, and car break-ins. Violent crime, including armed robbery and homicide, is also on the rise in Cuba.
U.S. law and regulation prohibit travel to, from, or within Cuba for tourist activities. OFAC regulates travel to, from, and within Cuba by persons subject to U.S. jurisdiction, defined to include, among other things, all U.S. citizens or residents (wherever located) and anyone in the United States, regardless of their citizenship and nationality. Failure by a person subject to U.S. jurisdiction to act consistently with the regulations may result in penalties and criminal prosecution. Travel to Cuba without an OFAC license is illegal.
Cuba’s electrical supply is unreliable. Since October 2024, there have been several prolonged nationwide power outages. Scheduled and unscheduled power cuts lasting up to 12 hours occur daily in Havana, and even longer outside the capital. Some large businesses, hotels, hospitals, and institutions use generators during power outages. However, they may have trouble keeping the generators running during a long outage due to the inconsistent and scarce availability of fuel.
U.S. citizens in Cuba or those planning to visit should check local news often to stay up to date. In Cuba, peaceful assembly and freedom of speech are not protected rights. U.S. citizens should avoid protests or demonstrations.
U.S. Embassy employees must follow a special notification process with the Government of Cuba to travel outside of Havana. This process can impact the embassy’s ability to help U.S. citizens in Cuba during emergencies.
If a person subject to U.S. jurisdiction travels to Cuba consistent with 1 of the 12 travel categories authorized by a general OFAC license, the person would not need to apply for a specific OFAC license for the travel transactions. For non-tourist travel that is not otherwise covered by a general license, a person subject to U.S. jurisdiction must seek a specific license from OFAC to authorize the travel. For travel questions, check 31 C.F.R. 515.560 and OFAC’s Frequently Asked Questions.
Read the country information page for additional information on travel to Cuba.
If you decide to travel to Cuba:
- Stay aware of your surroundings.
- Do not physically resist any robbery attempt.
- Do not display signs of wealth, such as expensive watches or jewelry.
- Prepare for prolonged power outages by:
- Keeping mobile phones and portable battery banks charged.
- Having flashlights and spare batteries easily accessible.
- Stocking up on nonperishable food and water.
- Preparing alternative methods to meet your medical needs (medical devices requiring power, medicines requiring refrigeration, etc.)
- Obtain any required OFAC licenses as it is illegal to travel to Cuba without an appropriate license.
- Enroll in the Smart Traveler Enrollment Program (STEP) to receive messages and Alerts from the U.S. Embassy and make it easier to locate you in an emergency.
- Prepare a plan for emergency situations. Review the Traveler’s Checklist.
- Visit the CDC page for the latest Travel Health Information related to your travel and return to the United States.
We highly recommend buying insurance before you travel. Check with your travel insurance provider about evacuation assistance, medical insurance, and trip cancellation coverage.
Date Issued: Mon, 19 Aug 2024
Reissued after periodic review without changes.
Exercise normal precautions in Curaçao.
Read the country information page for additional information on travel to Curaçao.
If you decide to travel to Curacao:
Date Issued: Mon, 13 Jan 2025
Reissued after periodic review with minor edits
Exercise normal precautions in Cyprus. Some areas have increased risk. Read the entire Travel Advisory.
Country Summary: Do not attempt to enter the United Nations buffer zone at any place other than a designated crossing point. Police and UN peacekeeping forces strictly enforce this restriction.
Read the country information page for additional information on travel to Cyprus.
If you decide to travel to Cyprus:
Turkish Cypriot-Administered Area – Exercise increased caution
- The U.S. Embassy in Nicosia has limited ability to assist U.S. citizens in this area.
- Human rights reports show that central prison and police detention facilities in this area do not meet international standards.
Since 1974, the southern part of Cyprus has been under the control of the internationally recognized Government of the Republic of Cyprus. The northern part of Cyprus, administered by Turkish Cypriots, proclaimed itself the “Turkish Republic of Northern Cyprus” (“TRNC”) in 1983. The United States does not recognize the “TRNC,” nor does any country other than Türkiye. A buffer zone, patrolled by the UN Peacekeeping Force in Cyprus, separates the two sides. For U.S. citizen travelers:
- Enter and exit the island of Cyprus ONLY at Larnaca and Paphos airports or at the seaports of Limassol, Larnaca, and Paphos. The Republic of Cyprus does not consider entry via Ercan Airport or by a seaport in the north to be a legal entrance or departure to Cyprus. U.S. citizens who depart the island from Ercan could have difficulty returning to the Republic of Cyprus in the future.
- You cannot receive a residency permit from the Republic of Cyprus to reside in the area administered by Turkish Cypriots.
- The Republic of Cyprus does not recognize residence permits issued by Turkish Cypriots. If you arrive to the island at a north seaport or Ercan airport or stay in the Turkish Cypriot-administered area for over 90 days, you might be subsequently denied entry into the Republic of Cyprus.
- The U.S. Embassy has limited ability to help U.S. citizens in need of assistance in the area administered by Turkish Cypriots as the government of the Republic of Cyprus does not control the area. Travelers should factor this consideration into their activities in this area.
Date Issued: Thu, 08 Jan 2026
Exercise normal precaution in Czechia.
Czechia is generally a safe destination for travelers. Travelers should remain vigilant against petty crime, such as pickpocketing and other minor theft, especially in tourist areas and on public transportation. Follow local laws and guidance from Czech authorities during your stay.
Review our travel guidance for the Czech Republic to learn how to prepare for a safe trip.
Date Issued: Tue, 12 Aug 2025
Updated due to changes to the Travel Advisory level, U.S. government restrictions on personnel, and information on armed conflict in North and South Kivu.
Reconsider travel to the Democratic Republic of the Congo (DRC) due to crime, and civil unrest. Some areas have increased risk due to armed conflict. Read the entire Travel Advisory.
Do Not Travel To:
- North and South Kivu provinces due to crime, terrorism, civil unrest, armed conflict, and kidnapping.
- Ituri province due to crime, civil unrest, terrorism, armed conflict, and kidnapping.
- Tanganyika, Haut Lomami, and the 3 Kasai provinces (Kasai, Kasai-Oriental, Kasai-Central) due to crime, civil unrest, armed conflict, and kidnapping.
- Mai-Ndombe province due to ethnic/communal violence.
Country Summary: Violent crime is common. This includes armed robbery, armed home invasion, and assault. Local police lack the resources to respond to serious crime in a timely and adequate manner. Assailants may pose as police or security agents. DRC law enforcement does not always inform the U.S. embassy when they arrest a U.S. citizen. They may also delay access to detained or charged U.S. citizens. DRC law enforcement has used violence and threats during interrogations.
Demonstrations are common in many cities, and some have turned violent. Police may respond with force, resulting in deaths and arrests. Looting, assault, traffic obstruction, property damage, and other violent actions occur when police don’t respond in a timely manner, or at all.
The U.S. government cannot provide emergency consular services to U.S. citizens outside of Kinshasa due to poor infrastructure and security risks. Due to the risks in the country, minor dependents cannot accompany U.S. government employees who work in the DRC.
Review the country information page for additional information on travel to the Democratic Republic of the Congo.
If you decide to travel to the Democratic Republic of the Congo:
- Visit our website for Travel to High-Risk Areas.
- Avoid demonstrations and crowds.
- Use caution when walking or driving.
- Always have a photocopy of your U.S. passport and DRC visa. Keep originals in a secure location. Carry your U.S. passport and DRC visa when crossing provincial borders or flying domestically.
- If you are arrested or detained, ask police or prison officials to notify U.S. Embassy Kinshasa immediately.
- Enroll in the Smart Traveler Enrollment Program (STEP) to receive Alerts from the U.S Embassy and make it easier to locate you in an emergency.
- Review the Country Security Report for the DRC.
- Prepare a plan for emergency situations. Review the Traveler’s Checklist. Ensure that documents and medications are easy to locate in case you need to leave on short notice.
- Visit the CDC page for the latest Travel Health Information related to your travel and return to the United States.
- We highly recommend that you buy insurance before you travel. Check with your travel insurance provider about evacuation assistance, medical insurance, and trip cancellation coverage.
- Develop a communication plan with family, your employer or host organization. Specify how you’ll confirm you’re safe (text, calls, etc.), how often, and who you’ll contact first to share the information.
North and South Kivu Provinces – Level 4: Do Not Travel
Active fighting is ongoing between armed groups and government military forces in the Kivu provinces; the M23 armed group is occupying major cities of Goma and Bukavu. Missiles and armed drones have been used in the conflict. The fighting has forced thousands of people from their homes which can cause instability in the province.
Violent crime is common throughout the Kivu provinces. This includes murder, rape, kidnapping, and pillaging. Road travelers are common targets for ambush, armed robbery, and kidnapping.
Terrorist and armed groups operate in the Kivu provinces. They have attacked military and civilian targets. This includes aid workers, businesspeople, and other NGO staff in the area.
There is risk of terrorist violence, including terrorist attacks and other activity in North and South Kivu provinces. Visit the U.S. Department of State’s country reports on terrorism to learn more.
Demonstrations and large gatherings can occur throughout the region, especially in urban areas. Mobs can form rapidly and turn violent, posing a threat to bystanders.
Due to the security risks, U.S. government employees working in the DRC must obtain special authorization to travel to North and South Kivu Provinces. Due to the risks, the U.S. government is unable to provide emergency services to U.S. citizens in the Kivu provinces.
Do not travel to these areas for any reason.
Visit our website for Travel to High-Risk Areas.
Ituri Province – Level 4: Do Not Travel
Violent crime continues throughout Ituri province. This includes murder, rape, kidnapping, and pillaging. Road travelers are common targets for ambush, armed robbery, and kidnapping.
Terrorist and armed groups operate in Ituri province. They have targeted both military and civilian sites. This includes humanitarian aid workers and other NGO staff in the area.
There is risk of terrorist violence, including terrorist attacks and other activity in Ituri province. Visit the U.S. Department of State’s country reports on terrorism to learn more.
Demonstrations and large gatherings can occur throughout these regions, especially in urban areas. Mobs can form rapidly and turn violent, posing a threat to bystanders.
Armed groups, individuals, and military forces routinely clash with each other. Civilians are frequently targeted in attacks.
Due to the security risks, U.S. government employees working in the DRC must obtain special authorization to travel to Ituri province. Due to the risks, the U.S. government is unable to provide emergency services to U.S. citizens in Ituri province.
Do not travel to these areas for any reason.
Visit our website for Travel to High-Risk Areas.
Tanganyika, Haut Lomami, and the 3 Kasai Provinces – Level 4: Do Not Travel
Violent crime like murder, rape, kidnapping, and robbery are common in these areas:
- Tanganyika
- Haut Lomami
- Kasai provinces: Kasai Oriental, Kasai Central, and Kasai.
Road travelers are common targets for ambush, armed robbery, and kidnapping.
Demonstrations and large gatherings can occur throughout these regions, especially in urban areas. Mobs can form rapidly and turn violent, posing a threat to bystanders.
Armed groups, individuals, and military forces routinely clash with each other. Civilians are frequently targeted in attacks.
Due to the security risks, U.S. government employees working in the DRC must obtain special authorization to travel to eastern DRC Region and the 3 Kasai provinces. Due to the risks, the U.S. government is unable to provide emergency services to U.S. citizens in eastern DRC Region and the 3 Kasai provinces.
Do not travel to these areas for any reason.
Visit our website for Travel to High-Risk Areas.
Mai-Ndombe Province – Level 4: Do Not Travel
Violence in Mai-Ndombe is rising. There are also more police and military in the area, especially along the Route Nationale 17. Government security officials may limit travel for U.S. citizens when violence rises. Activity of armed groups could block passenger and freight traffic on regional routes in the province. Protests can occur without warning.
Due to the security risks, U.S. government employees working in the DRC must obtain special authorization to travel to Mai-Ndombe province. Due to the risks, the U.S. government is unable to provide emergency services to U.S. citizens in Mai-Ndombe province.
Do not travel to these areas for any reason.
Visit our website for Travel to High-Risk Areas
Date Issued: Tue, 17 Sep 2024
Reissued after periodic review with minor edits.
Exercise increased caution in the Kingdom of Denmark due to terrorism.
Country Summary: Terrorist groups continue plotting possible attacks in the Kingdom of Denmark. Terrorists may attack with little or no warning, targeting tourist locations, transportation hubs, markets/shopping malls, local government facilities, hotels, clubs, restaurants, places of worship, parks, major sporting and cultural events, educational institutions, airports, and other public areas.
Greenland and the Faroe Islands are part of the Kingdom of Denmark. For additional information, please review the country information pages for Denmark and the Faroe Islands.
If you decide to travel to the Kingdom of Denmark:
- Be aware of your surroundings when traveling to tourist locations and crowded public venues.
- Follow the instructions of local authorities.
- Monitor local media for breaking events and adjust your plans based on new information.
- Enroll in the Smart Traveler Enrollment Program (STEP) to receive Alerts and make it easier to locate you in an emergency.
- Follow the Department of State on Facebook and X/Twitter.
- Follow the U.S. Embassy in Copenhagen on Facebook and X/Twitter.
- Review the Country Security Report for Denmark.
- Prepare a contingency plan for emergency situations. Review the Traveler’s Checklist.
Date Issued: Thu, 06 Mar 2025
Updated to remove Crime indicator and to include area-specific Level 3 advisory for the border with Eritrea.
Exercise increased caution in Djibouti due to terrorism. Some areas have increased risk. Read the entire Travel Advisory.
Reconsider travel to:
- Areas bordering Eritrea due to border tensions
Terrorists may attack with little or no warning. Terrorists target public areas including:
- Tourist locations
- Transportation centers (airports)
- Government buildings
- Markets and shopping malls
- Hotels, clubs, and restaurants
- Places of worship and schools
- Parks and public areas
- Major sporting and cultural events
- Hospitals
Read the Country Information Page for more information on travel to Djibouti.
If you decide to travel to Djibouti:
- Stay aware of your surroundings.
- Check local media for breaking news. Be prepared to adjust your plans.
- Enroll in the Smart Traveler Enrollment Program (STEP) to receive alerts from the U.S. Embassy. It makes it easier to locate you in an emergency.
- Review the Country Security Report for Djibouti.
- Prepare a backup plan for emergency situations. Review the Traveler’s Checklist.
- Visit the CDC page for the latest Travel Health Information related to your travel and return to the United States.
- We highly recommend that you buy insurance before you travel. Check with your travel insurance provider about evacuation assistance, medical insurance, and trip cancellation coverage.
Border with Eritrea – Level 3: Reconsider Travel
U.S. citizens should reconsider travel within 10 miles of the border with Eritrea in the Tadjoura and Obock regions due to government of Djibouti restrictions.
The U.S. government has limited ability to provide emergency services to U.S. citizens in the region. U.S. government employees are prohibited from travelling after dark anywhere within 10 miles of the Eritrean border region.
Visit our website for Travel to High-Risk Areas.
Date Issued: Thu, 22 Aug 2024
Reissued after periodic review with minor edits.
Exercise normal precautions in Dominica.
Read the country information page for additional information on travel to Dominica.
If you decide to travel to Dominica:
Date Issued: Thu, 12 Jun 2025
Updated after periodic review with minor edits. Last updated June 18, 2024.
Exercise increased caution in the Dominican Republic due to crime.
Advisory Summary: Violent crime is a concern in the Dominican Republic despite more police presence in areas often visited by tourists. Do not display wealth and be wary of meeting individuals from online in secluded locations.
If you decide to travel to the Dominican Republic, note that violent crime is a concern throughout the country affecting all residents regardless of nationality, including:
- Robbery
- Homicide
- Sexual assault
Resources available to tourists:
- 911 emergency response system
- Professional tourist police force (POLITUR)
- Private security personnel in resorts
Safety tips:
- Pay attention to your surroundings.
- Do not carry or wear valuable items that will attract attention.
- Be vigilant about where your phone is and avoid using it openly on the street.
- If robbed, hand over your personal belongings without resisting.
- Travel with a partner or group if possible.
- Do not leave food or drinks unattended.
Criminals are rarely caught and prosecuted.
U.S. citizens should always exercise caution when traveling abroad. Use these general tips to stay safe:
Follow the Department of State on Facebook, X (formerly Twitter), and Instagram.
Date Issued: Tue, 14 Oct 2025
There was no change to the advisory level. The “terrorism” risk indicator was added. Advisory summary was updated.
Exercise increased caution in Ecuador due to risk of crime, terrorism, unrest, and kidnapping. Some areas have increased risk. Read the entire Travel Advisory.
Do Not Travel to these areas due to terrorism and crime:
- Guayaquil, south of Portete de Tarqui Avenue.
- The cities of Huaquillas and Arenillas in the province of El Oro.
- The cities of Quevedo, Quinsaloma, and Pueblo Viejo in the province of Los Rios.
- The canton of Duran, in the province of Guayas.
- Esmeraldas City and all areas north of Esmeraldas City in Esmeraldas province.
- The area north of Esmeraldas City to the Colombian border and east to Carchi province.
Reconsider Travel to these areas due to terrorism and crime:
- Guayaquil north of Portete de Tarqui Avenue.
- El Oro province outside the cities of Huaquillas and Arenillas.
- Los Rios province outside the cities of Quevedo, Quinsaloma, and Pueblo Viejo.
- All areas south of Esmeraldas city in Esmeraldas province.
- The provinces of Sucumbios, Manabi, Santa Elena, and Santo Domingo.
Advisory Summary:
Crime and kidnapping
Crime is a widespread problem in Ecuador. Violent crime typically associated with narcotrafficking is common. It includes murder, assault, kidnapping, and armed robbery. Areas with transnational criminal organizations see much higher rates of violent crime. U.S. citizens and LPRs have been victims of kidnapping and extortion.
Terrorism
There is risk of terrorist violence, including terrorist attacks and other activity in Ecuador. Visit the U.S. Department of State’s country reports on terrorism to learn more.
Demonstrations
- Demonstrations happen across the country.
- They are usually driven by political or economic reasons.
- Demonstrators often block local roads and major highways without warning, disrupting access to important infrastructure.
Local and U.S. Government Assistance
- Most of Ecuador’s land is empty and remote, especially outside big towns and cities.
- Local and U.S. government help may be very limited in remote areas. This may cause delays for U.S. citizens in remote areas.
Land Border Restrictions
- Foreign citizens entering the country by land from Colombia or Peru must show a certificate of no criminal record. This certificate must be apostilled. You can find more information on the Ministry of Tourism’s webpage and at Ecuador.Travel.
- The U.S. Embassy and Consulate General in Ecuador cannot help you get the necessary documents for crossing a land border.
- U.S. citizens planning to enter Ecuador via a land border should check the State Department’s Office of Authentications webpage and Criminal Records Check webpage. These pages have information on getting a criminal record check and apostille from the United States.
Read the destination information page for additional information on traveling to Ecuador.
Risks in specific areas
Level 4: Do Not Travel
Do not travel to these areas for any reason due to terrorism and crime.
- Guayaquil, south of Portete de Tarqui Avenue.
- The cities of Huaquillas and Arenillas in the Province of El Oro.
- The cities of Quevedo, Quinsaloma, and Pueblo Viejo in the province of Los Rios.
- The canton of Duran, in the province of Guayas.
- Esmeraldas city and all areas north of Esmeraldas city in Esmeraldas province.
Review our information on Crime Abroad and for Victims of Crime.
Terrorists, Transnational Criminal Groups, and Local Gangs
- Terrorist and other criminal organizations often commit violent acts in these areas, including sudden attacks in public places, often without warning.
- Violent crimes can involve murder, targeted assassinations, armed robberies, bombings, kidnappings, and assaults.
- Violence in these areas has risen both in frequency and brutality recently, posing a security risk to U.S. citizens.
- U.S. government employees working in Ecuador must get special permission to travel to these areas.
- The U.S. government has limited ability to provide emergency services to U.S. citizens in these areas.
Level 3: Reconsider Travel
Reconsider travel to these areas due to terrorism and crime:
- Guayaquil, north of Portete de Tarqui Avenue.
- El Oro province outside the cities of Huaquillas and Arenillas.
- Los Rios province outside the cities of Quevedo, Quinsaloma, and Pueblo Viejo.
- All areas south of Esmeraldas city in Esmeraldas province.
- The provinces of Sucumbios, Manabi, Santa Elena, and Santo Domingo.
Review our information on Crime Abroad and for Victims of Crime.
Terrorist and other criminal organizations have engaged in violent activity in these areas. Recently, this violence has increased. U.S. government personnel must be very careful and stay alert when traveling in and around these areas. The U.S. government has limited ability to provide emergency services to U.S. citizens in these areas.
If you decide to travel to Ecuador:
- Enroll in the Smart Traveler Enrollment Program (STEP) to get important updates and alerts from the U.S. embassy or consulate. Enrolling helps the U.S. embassy or consulate contact you or your emergency contact in an emergency.
- Review our information on Terrorism and Travel to High-Risk Areas.
- Monitor local media for breaking news. Be prepared to adjust your plans.
- Stay aware of your surroundings.
- Establish a proof of life protocol with your loved ones. If you are taken hostage, your loved ones will know specific questions (and answers) to ask the hostage-takers to confirm that you are being held captive and alive.
- Keep travel documents up to date and easily accessible.
- Avoid demonstrations and crowds.
- Check local media for breaking news.
- Review the Country Security Report for Ecuador.
- Prepare a plan for emergency situations. Review the Traveler’s Checklist.
- Visit the Centers for Disease Control and Prevention (CDC) website for the latest Travel Health Information for Ecuador.
- We highly recommend that you buy insurance before you travel. Check with your travel insurance provider about evacuation assistance, medical insurance, and trip cancellation coverage.
- Review our information on U.S. Citizens Missing Abroad and for Victims of Crime.
Review Travel to High-Risk Areas
Date Issued: Tue, 15 Jul 2025
Updated to reflect a change in Travel Advisory level.
Exercise increased caution in Egypt due to terrorism, crime, and health. Some areas have increased risk. Read the entire Travel Advisory.
Do not travel to:
- The Northern and Middle Sinai Peninsula due to terrorism.
- The Western Desert due to risk to safety and security unless traveling with a professionally licensed tour company.
- Egyptian border areas due to military zones.
Country Summary: The U.S. Embassy has limited ability to help dual national U.S.-Egyptian citizens who are arrested or detained. Egyptian law considers dual citizens to be solely Egyptian citizens.
Terrorism: There is risk of terrorist violence, including terrorist attacks and other activity in Northern and Middle Sinai Peninsula. Visit the U.S. Department of State’s country reports on terrorism to learn more. Terrorists may attack with little or no warning:
Egyptian authorities generally offer effective security protection. However, extremists continue to express interest in planning and carrying out attacks. Security is generally present at potential targets, which include:
- Religious sites (mosques, churches, monasteries, and buses traveling there)
- Local government buildings, and diplomatic facilities (embassies)
- Tourist sites
- Transportation centers
- Shopping malls
- Restaurants and foreign businesses
- Resorts
- Roadside checkpoints
- Urban areas in Cairo
Crime: Most crimes against foreigners are crimes of opportunity, like purse snatching and pickpocketing. Harassment of women, including foreigners, is a problem in Egypt. It can include vulgar comments, gestures, indecent exposure, and unwanted physical contact. Tourists should beware of overcharging and scams in tourist areas.
Review the Country Security Report for Egypt for further details.
Health: Emergency and intensive care facilities are limited in Egypt and may be unavailable in remote areas. Ambulances are rare, unreliable in most areas, and don’t have advanced medical equipment.
Global Polio: Some international destinations, including Egypt, have circulating poliovirus. Before traveling to Egypt, make sure you are up to date on your polio vaccines. Check the CDC website for current vaccination recommendations: Egypt – Traveler view | Travelers’ Health | CDC
Protests or demonstrations may occur suddenly:
- Individuals have been arrested for being in the vicinity of protests in Egypt, even when not actively participating.
- U.S. citizens have been arrested for participating in protests.
- You may be detained for posting anything on social media seen as critical of Egypt or its allies, or for disrespecting its cultural sites.
- Local law prohibits protesting or demonstrating without a permit.
Read the country information page for additional information on travel to Egypt.
If you decide to travel to Egypt:
- Keep travel documents up to date and easily accessible.
- Make contingency plans to leave the country without U.S. government assistance.
- Check local laws and conditions before traveling.
- Avoid demonstrations and crowds.
- Stay alert in tourist locations.
- Get comprehensive medical insurance that includes medical evacuation.
- Enroll in the Smart Traveler Enrollment Program (STEP) to receive Alerts and make it easier to locate you in an emergency.
- Review the Country Security Report for Egypt.
- Prepare a contingency plan for emergency situations. Review the Traveler’s Checklist.
- Visit the CDC page for the latest Travel Health Information related to your travel.
- We highly recommend that you buy insurance before you travel. Check with your travel insurance provider about evacuation assistance, medical insurance, and trip cancellation coverage.
Northern and Middle Sinai Peninsula – Level 4: Do Not Travel
Do not travel to this area for any reason.
The Northern and Middle Sinai Peninsula remains a dangerous area, with occasional attacks on security forces and civilians:
- Due to the risks, the U.S. government has limited ability to provide emergency services to U.S. citizens in areas within the Sinai.
- U.S. government employees are not authorized to freely travel into the northern and middle Sinai Peninsula.
- Access is highly regulated by the Government of Egypt.
For more information visit Travel to High-Risk Areas.
The Western Desert – Level 4: Do Not Travel
Avoid all travel to the Western Desert due to safety risks. If you go, make sure to travel with a licensed tour company.
For more information visit Travel to High-Risk Areas.
Egyptian Border Areas – Level 4: Do Not Travel
Do not travel to this area for any reason.
Avoid travel to Egyptian border areas due to security risks, including:
- Military zones: There is instability in neighboring territories. Egypt’s border areas with Libya, Sudan, and in Sinai are military zones. Movements by private individuals are limited and closely watched.
Due to the risks, the U.S. government has limited ability to provide emergency services to U.S. citizens in these regions: U.S. government employees cannot travel freely in these areas.
For more information visit Travel to High-Risk Areas.
Date Issued: Tue, 08 Apr 2025
Updated due to change in travel advisory level to reflect changes in crime.
Country Summary: Exercise normal precautions in El Salvador. Gang activity has decreased over the last three years. This has caused a drop in violent crimes and murders.
U.S. government employees working in El Salvador are allowed to travel throughout the country during daylight hours. However, due to the risks, U.S. government employees are prohibited from traveling between cities or departments at night.
There are exceptions. U.S. government employees are allowed to travel at all hours between San Salvador and:
- El Salvador’s international airport.
- La Libertad department.
U.S. government employees are prohibited from using public buses.
State of Exception
In March 2022, the Government of El Salvador declared a “State of Exception” in response to an increase in gang murders:
- The State of Exception allows local authorities to arrest anyone they think is involved in gang activity.
- It suspends several constitutional rights. This includes the normal protections of criminal procedure, like the right to a speedy or fair trial.
- Tens of thousands of people are currently in prison under the State of Exception.
- Several U.S. and other foreign citizens have been detained under the State of Exception. They remain in prison and have yet to face trial.
The State of Exception is still in place.
Read the country information page for additional information on travel to El Salvador.
If you decide to travel to El Salvador:
- Always use major highways and roads.
- Minimize travel outside of major cities at night.
- El Salvador has zero tolerance for driving under the influence of alcohol. You can be detained for having any level of alcohol while driving. Do not drink and drive.
- Stay aware of your surroundings.
- When possible, travel in pairs or in groups, especially for long trips and in rural places.
- Avoid relying on online maps or applications. They might not accurately show local road conditions.
- Do not hitchhike.
- Ensure you have multiple forms of communication when traveling and the ability to charge your devices.
- Do not physically resist any robbery attempt.
- Stay alert when visiting banks or ATMs.
- Do not display signs of wealth, such as expensive watches or jewelry.
- Engage local guides certified by the national or local tourist authority when hiking in backcountry areas.
- Use caution when swimming near El Salvador’s beaches. Follow water condition warnings.
- Enroll in the Smart Traveler Enrollment Program (STEP) to receive Alerts from the U.S. Embassy and make it easier to locate you in an emergency.
- Review the Country Security Report for El Salvador.
- Prepare a backup plan for emergency situations. Review the Traveler’s Checklist.
- Visit the CDC page for the latest Travel Health Information related to your travel and return to the United States.
- We highly recommend that you buy insurance before you travel. Check with your travel insurance provider about evacuation assistance, medical insurance, and trip cancellation coverage.
Date Issued: Tue, 07 Oct 2025
There was no change to the advisory level. The “Other” risk indicator was added. Advisory summary was updated.
Exercise Increased Caution in Equatorial Guinea due to risk of crime, health, and arbitrary enforcement of laws.
Review our information on Travel to High-Risk Areas.
Advisory summary:
Crime
Petty crime is common throughout the country. Local police may lack the resources to respond effectively to reports of crime, even serious crime.
Health
Medical services in Equatorial Guinea are limited. There are no adequate trauma or ambulance services. Even minor health issues may require medical evacuation at the traveler’s expense. Be sure to bring enough prescription medications to last the entire duration of your trip. Make sure you have medical or travel insurance that includes medical evacuation. Review our information on Travel Insurance.
Other
Travelers face the risk of arbitrary enforcement of local laws that may result in harassment and detention.
If you decide to travel to Equatorial Guinea:
- Review our information on Crime Abroad and for Victims of Crime.
- Borders may close without notice. Travelers should remain flexible and prepared for sudden changes.
- Always travel with your passport and valid visa to avoid complications at checkpoints or border crossings. Keep a copy of your passport and visa in a safe location in your hotel or residence.
- Do not physically resist any robbery attempt.
- Use caution when walking or driving at night.
- Keep a low profile.
- Stay aware of your surroundings.
- Do not display signs of wealth, like expensive watches or jewelry.
- Do not answer your door at your hotel or residence unless you know who it is.
- Stay alert in tourist spots.
- Stay alert when visiting banks or ATMs.
- Give your itinerary to a family member or friend.
- Medical services for routine and emergency procedures are limited. Read the Health section of the Travel Guidance on this page for more information.
- Make sure you have medical or travel insurance that includes medical evacuation. Review our information on Travel Insurance.
- Check with your doctor about required vaccines and shots for high-risk exposure before you go to Equatorial Guinea. Review the Health section in the Travel Guidance for Equatorial Guinea.
- Bring enough supply of over the counter and prescription medicines to cover the duration of the trip.
- Some travelers have been arbitrarily detained for several weeks or more. The Embassy cannot guarantee your release.
- Enroll in the Smart Traveler Enrollment Program (STEP) to get important updates and alerts from the U.S. embassy or consulate. Enrolling helps the U.S. embassy or consulate contact you or your emergency contact in an emergency.
- Review the Country Security Report for Equatorial Guinea.
- Visit the Centers for Disease Control and Prevention (CDC) website for the latest Travel Health Information for Equatorial Guinea.
- Whether you’re a first time or frequent traveler, use the International Travel Checklist.
Date Issued: Mon, 31 Jul 2023
Reissued with obsolete COVID-19 page links removed.
Exercise increased caution in Eritrea due to travel restrictions, limited consular assistance, landmines, and wrongful detentions.
Country Summary: The U.S. government has limited ability to provide emergency services to U.S. citizens in Eritrea, as U.S. government employees must obtain special authorization to travel outside of Asmara.
U.S. citizens visiting or residing in Eritrea, including dual U.S.-Eritrean nationals, have been arrested and detained without charge or on false charges. The Department has determined that the risk of wrongful detention of U.S. nationals by the Eritrean government exists.
Eritrean law enforcement officials routinely block access by U.S. government officials to U.S. citizens in detention. The U.S. Embassy therefore may not receive notification of your arrest or be allowed access to you if you are detained or arrested.
There are landmines in many remote areas in Eritrea, particularly in Nakfa, AdiKeih, Arezza, the 25 mile-wide region (40 km) between the Setit and Mereb Rivers, and in areas north and west of Keren, areas near Massawa, Ghinda, Agordat, Barentu, Dekemhare, and south of Tessenae.
Read the country information page for additional information on travel to Eritrea.
If you decide to travel to Eritrea:
Date Issued: Tue, 23 Jul 2024
Reissued after periodic review without changes.
Exercise normal precautions in Estonia.
Read the country information page for additional information on travel to Estonia.
If you decide to travel to Estonia:
Date Issued: Mon, 01 Jul 2024
Reissued after periodic review without changes.
Exercise increased caution in Eswatini due to crime and civil unrest.
Country Summary: Crime is common in Eswatini and sporadic armed robberies and carjackings do occur. Local police may lack the resources to deal effectively with criminal incidents.
Demonstrations and protests occur sporadically in Eswatini. U.S. citizens are reminded to avoid all gatherings, even peaceful ones, as they could turn violent with little or no warning.
Read the country information page for additional information on travel to Eswatini.
If you decide to travel to Eswatini:
- Avoid demonstrations and crowds.
- Monitor local media for breaking events and be prepared to adjust your plans.
- Keep travel documents up to date and easily accessible.
- Have evacuation plans that do not rely on U.S. government assistance.
- Enroll in the Smart Traveler Enrollment Program (STEP) to receive Alerts and make it easier to locate you in an emergency.
- Follow the Department of State on Facebook and Twitter.
- Review the Country Security Report for Eswatini.
- Prepare a contingency plan for emergency situations. Review the Traveler’s Checklist.
- Visit the CDC page for the latest Travel Health Information related to your travel.
Date Issued: Mon, 31 Jul 2023
Reissued with obsolete COVID-19 page links removed.
Reconsider travel to Ethiopia due to sporadic violent conflict, civil unrest, crime, communications disruptions, terrorism and kidnapping in border areas.
Do Not Travel To:
- Tigray Region and border with Eritrea due to sporadic violent conflict, civil unrest, and crime.
- Afar-Tigray border areas due to sporadic violent conflict, civil unrest, and crime.
- Amhara Region due to sporadic violent conflict and civil unrest.
- Gambella and Benishangul Gumuz Regions due to crime, kidnapping, ethnically motivated violence, and sporadic violent conflict
- Oromia Region – Specific areas due to sporadic violent conflict, civil unrest, and ethnically motivated violence.
- Southern Nations and National People (SNNP) Region due to sporadic violent conflict, civil unrest, and ethnically motivated violence.
- Border area with Somalia due to terrorism, kidnapping, and landmines.
- Border areas with Sudan, and South Sudan due to crime, kidnapping, civil unrest, and sporadic violent conflict.
- Border areas with Kenya due to the potential for terrorism and ethnically motivated violence.
The security situation in Addis Ababa is stable. However, there is sporadic violent conflict and civil unrest in other areas of Ethiopia, and the security situation may deteriorate without warning. The U.S. Embassy is unlikely to be able to assist with departure from the country if the security situation deteriorates. Due to sporadic violent conflict and civil unrest throughout parts of Ethiopia, travel by U.S. government personnel is routinely assessed for additional restrictions. Please see information on What the Department of State Can and Can’t Do in a Crisis.
U.S. officials have limited ability to provide services to U.S. citizens outside of Addis Ababa and have very limited consular access to U.S. citizens detained by Ethiopian authorities. The government of Ethiopia has previously restricted or shut down internet, cellular data, and phone services before, during, and after civil unrest. These restrictions impede the U.S. Embassy’s ability to communicate with and provide consular services to U.S. citizens in Ethiopia.
Please contact the Embassy’s American Citizen Services Unit at [email protected] for further assistance.
Read the country information page for additional information about travel to Ethiopia.
If you decide to travel to Ethiopia:
- Monitor local media for breaking events and be prepared to adjust your plans.
- Be aware of your surroundings.
- Stay alert in locations frequented by U.S. citizens/Westerners/foreign travelers.
- Carry a copy of your passport and visa and leave originals in your hotel safe.
- Have evacuation plans that do not rely on U.S. government assistance.
- Enroll in the Smart Traveler Enrollment Program (STEP) to receive Alerts and make it easier to locate you in an emergency.
- Alerts and make it easier to locate you in an emergency.
- Follow the Department of State on Facebook and Twitter.
- Review the Country Security Report for Ethiopia.
- U.S. citizens who travel abroad should always have a contingency plan for emergency situations. Review the Traveler’s Checklist.
- Visit the CDC page for the latest Travel Health Information related to your travel.
Tigray Region and Border with Eritrea – Do Not Travel
Due to sporadic violent conflict, civil unrest, and crime, the Tigray Region and the border with Eritrea are restricted for travel by U.S. government personnel, with limited exceptions to support humanitarian capacity and priority diplomatic engagement efforts. Border roads with Eritrea are closed and conditions at the border may change with no warning.
Afar-Tigray Border Area – Do Not Travel
Due to sporadic violent conflict, civil unrest, and crime, the Afar-Tigray border area is restricted for travel by U.S. government personnel, with limited exceptions to support humanitarian capacity and priority diplomatic engagement efforts.
Amhara Region – Do Not Travel
Due to sporadic violent conflict and civil unrest, the Amhara Region is currently off-limits for U.S. government personnel, with limited exceptions to support humanitarian capacity and priority diplomatic engagement efforts.
Gambella Region – Do Not Travel
Due to crime, kidnapping, the potential for ethnically motivated violence, and sporadic violent conflict, the Gambella Region is restricted for travel by U.S. government personnel, with limited exceptions to support humanitarian capacity and priority diplomatic engagement efforts.
Benishangul Gumuz Region – Do Not Travel
Due to crime, kidnapping, the potential for ethnically motivated violence and sporadic violent conflict, the Benishangul Gumuz Region is restricted for travel by U.S. government personnel, with limited exceptions to support humanitarian capacity and priority diplomatic engagement efforts.
Oromia Region – Specific Areas – Do Not Travel
Due to sporadic violent conflict, civil unrest, and ethnically motivated violence, the following zones in Oromia are restricted for travel by U.S. government personnel, with limited exceptions to support humanitarian capacity and priority diplomatic engagement efforts: the entirety of Horro-Guduru Wollega, East Wollega, West Wollega, Kelem Wollega, Illubabor, and Bale. Other areas in Oromia include portions of North, West, and Southwest Shewa to the immediate north and west of Addis Ababa; the Boset and Fentale woredas of East Shewa zone between Welenchiti and Awash; portions of the Borena zone surrounding Bule Hora; and portions of Guji zone to the east of Bule Hora.
Southern Nations and National People (SNNP) Region – Specific Areas – Do Not Travel
Due to sporadic violent conflict, civil unrest, and ethnically motivated violence the following towns and areas in SNNP are restricted for travel by U.S. government personnel, with limited exceptions to support humanitarian capacity and priority diplomatic engagement efforts: Gedeo, Konso zones and the Amaro and Derashe special woredas.
Border Area with Somalia – Do Not Travel
Terrorists maintain a presence in Somali towns near the Ethiopian border, presenting a risk of cross-border attacks and kidnappings. Landmines are present in this region. U.S. government personnel are not permitted to travel to the border areas with Somalia, with limited exceptions to support humanitarian capacity efforts.
Border Areas with Sudan and South Sudan – Do Not Travel
Crime, kidnapping, the potential for ethnically motivated violence, and sporadic violent conflict exist near the Ethiopian borders with Sudan and South Sudan. This includes but is not limited to the Nuer Zone and the Jore Woreda of the Agnuak Zone in the Gambela region, and the Pawe, Guba, Dangur, Dibati, and Bulen woredas, and the Metekel zone in the Benishangul Gumuz Region. U.S. government personnel are not permitted to travel to the border areas of Sudan and South Sudan, with limited exceptions to support humanitarian capacity efforts.
Border Areas with Kenya – Do Not Travel
Terrorists, particularly Al-Shabaab, maintain a presence in this area, and ethnically motivated violence has been reported. This includes but is not limited to the Borena zone and surrounding areas. U.S. government personnel are not permitted to travel to the border areas with Kenya, with limited exceptions to support humanitarian capacity efforts.
Visit our website for advice if you decide to Travel to High-Risk Areas.
Date Issued: Wed, 22 Jan 2025
Reissued after periodic review without changes.
Exercise normal precautions in the Federated States of Micronesia (FSM).
Read the country information page for additional information on travel to the FSM.
If you decide to travel to the FSM:
- Monitor available local news reports and be prepared to adjust your plans. The FSM has a limited media environment, so breaking news may only be available via social media or word of mouth.
- Visit the FSM government website if appropriate for non-health conditions.
- Visit the website for the Department of Health and Social Affairs for the latest information from the FSM Government on current public health concerns.
- Ensure your passport is valid for at least six months beyond your intended stay.
- Enroll in the Smart Traveler Enrollment Program (STEP) to receive Alerts and make it easier to locate you in an emergency.
- Follow the Department of State on Facebook and X/Twitter.
- Review the Country Security Report for the Federated States of Micronesia (FSM)
- Prepare a contingency plan for emergency situations. Review the Traveler’s Checklist.
- Visit the CDC page for the latest Travel Health Information related to your travel.
Date Issued: Mon, 02 Dec 2024
Reissued after periodic review without changes.
Exercise normal precautions in Fiji. Some areas have increased risks. Read the entire Travel Advisory.
Read the country information page for additional information on travel to Fiji.
If you decide to travel to Fiji:
- Enroll in the Smart Traveler Enrollment Program (STEP) to receive security messages and make it easier to locate you in an emergency.
- Follow the Department of State on Facebook and X/Twitter.
- Review the Country Security Report for Fiji.
- Visit the CDC page for the latest Travel Health Information related to your travel.
- Be aware of your surroundings at all times and to be extra vigilant when displaying items like jewelry, bags and cell phones in public.
- Do not physically resist any robbery attempt. Use caution when walking or driving at night.
- Prepare a contingency plan for emergency situations. Review the Traveler’s Checklist.
Colo I Suva Forest Park – Level 2: Exercise Increased Caution
Crime along the trails, particularly phone and bag snatchings, occurs frequently in areas where foreigners gather; resistance can result in injury.
Date Issued: Fri, 09 Aug 2024
Reissued after periodic review without changes.
Exercise normal precautions in Finland.
Read the country information page for additional information on travel to Finland.
If you decide to travel to Finland:
Date Issued: Wed, 28 May 2025
Reissued after periodic review with minor edits.
Exercise increased caution in France due to terrorism and civil unrest.
Advisory Summary: Pickpocketing and phone thefts are common, especially in crowded places. Terrorist groups continue to plan possible attacks in France and may attack with little to no warning. There are also regular, peaceful protests and strikes in Paris and other cities throughout France.
- Pickpocketing and phone thefts are frequent crimes. They can occur in crowded areas such as:
- Airports
- Subways and train cars
- Tourist attractions
- Train stations
- Terrorist groups continue to plan possible attacks in France. They may attack with little or no warning. Visit the U.S. Department of State’s country reports on terrorism to learn more.
- Possible targets include:
- Tourist locations
- Transportation hubs and airports
- Markets and shopping malls
- Local government facilities
- Hotels, restaurants, and clubs
- Places of worship
- Major sporting and cultural events
- Educational institutions
- Parks
- Other public areas
- Peaceful demonstrations and strikes happen often in Paris and other cities in France.
- Protests can disrupt transportation services.
- On rare occasions, protests have turned violent or caused property damage.
- Police may respond with water cannons and tear gas.
Tips for travel to France:
- Stay alert at tourist locations and crowded public places.
- Avoid demonstrations and areas with significant police activity.
- Follow the instructions of local authorities including movement restrictions related to any ongoing police action.
- Check local media for breaking events. Be prepared to adjust your plans.
- Find a safe place to stay and shelter in place if you are unable to leave the immediate area of a demonstration.
If you decide to travel to France:
Date Issued: Thu, 16 Jan 2025
Exercise normal precautions in French Guiana.
Read the country information page for additional information on travel to French Guiana.
If you decide to travel to French Guiana:
Date Issued: Mon, 02 Dec 2024
Reissued after periodic review without changes
Exercise normal precautions in French Polynesia.
Read the country information page for additional information on travel to French Polynesia.
If you decide to travel to French Polynesia:
Date Issued: Thu, 22 Aug 2024
Reissued after periodic review with minor edits.
Exercise normal precautions in the French West Indies, which includes the islands of Guadeloupe, Martinique, French Saint Martin, and Saint Barthélemy.
Read the country information page for additional information on travel to the French West Indies.
If you decide to travel to the French West Indies:
Date Issued: Wed, 18 Dec 2024
Updated after periodic review to include an H indicator for health.
Exercise increased caution in Gabon due to crime, civil unrest, and health. Some areas have increased risk. Read the entire travel advisory.
Exercise Increased Caution in:
- Libreville and Port Gentil due to crime, which can include robbery, vehicle break-ins, and residential burglaries.
There is an increased military presence throughout Libreville and other areas of Gabon. Demonstrations may occur with little or no warning. A nighttime curfew is in effect and U.S. citizens should confirm and follow instructions of local authorities.
Access to medical care is limited. Medical facilities are limited in the quality and standard of care they can provide. They may not have adequate supplies of basic medications, especially outside of large cities.
Read the Country Information Page for additional information about travel to Gabon.
If you decide to travel to Gabon:
- Respect the curfew.
- Avoid demonstrations and crowds.
- Check local media for breaking events and prepare to adjust your plans.
- Keep travel documents up to date and easily accessible.
- Have evacuation plans that do not rely on U.S. government assistance.
- While travel medical insurance is recommended for all travelers, local medical facilities are likely to require full payment in cash at the time of service and may otherwise deny care.
- Travelers to Gabon should have medical evacuation insurance.
- Enroll in the Smart Traveler Enrollment Program (STEP) to receive security messages and make it easier to locate you in an emergency.
- Follow the Department of State on Facebook and X/Twitter.
- Review the Country Security Report for Gabon.
- Prepare a contingency plan for emergency situations. Review the Traveler’s Checklist.
- Visit the CDC page for the latest Travel Health Information related to your travel.
Date Issued: Thu, 13 Mar 2025
Last Update: Reissued after periodic review with minor edits.
Exercise normal precautions in Georgia. Some areas have increased risk. Read the entire Travel Advisory.
Do Not Travel To:
- The Russian-occupied Georgian regions of South Ossetia and Abkhazia due to risk of crime, civil unrest, and landmines.
Read the country information page for additional information on travel to Georgia.
If you decide to travel to Georgia:
South Ossetia and Abkhazia – Level 4: Do Not Travel
Russian troops and border guards occupy both South Ossetia and Abkhazia regions. The precise locations of administrative boundary lines are difficult to identify. Entering these areas could lead to arrest, imprisonment, or a fine. Violent attacks and criminal incidents occur in the region. Landmines are a danger to travelers near the boundary lines of both territories.
Due to the risks, U.S. government employees working in Georgia are prohibited from traveling to South Ossetia and Abkhazia. The U.S. government is unable to provide emergency services to U.S. citizens in South Ossetia and Abkhazia. Do not travel to these areas for any reason.
Visit our website for Travel to High-Risk Areas.
Date Issued: Tue, 13 May 2025
Reissued after periodic review with updates to Advisory Summary.
Exercise increased caution in Germany due to terrorism.
Advisory Summary: Terrorist groups and lone actors remain a constant threat in Germany and Europe, attacking people in public locations with knives, small arms, rudimentary explosive devices, and vehicles. Such attacks may occur with little or no warning and target:
- Tourist locations
- Transportation centers (airports, train, or bus stations)
- Markets and shopping malls
- Local government facilities
- Hotels, clubs, and restaurants
- Places of worship and educational institutions
- Parks
- Major sporting and cultural events
- Schools
If you decide to travel to Germany:
- Be aware of your surroundings when traveling to tourist locations and crowded public venues.
- Follow the instructions of local authorities.
- Monitor local media for breaking events and adjust your plans based on new information.
U.S. citizens should always exercise caution when traveling abroad. Use these general tips to stay safe:
Date Issued: Tue, 08 Apr 2025
Updated to reflect threats against women travelers and increased risks in specific regions.
Exercise increased caution in Ghana due to crime and violence against women travelers and lesbian, gay, and bisexual travelers. Some areas of Ghana have increased risk. Read the entire Travel Advisory.
Reconsider Travel to:
- The Upper East Region, North East Region, Upper West Region, and the western portion of the Savannah Region (all areas west of the N12 Highway) that shares a border with Burkina Faso and Cộte d’Ivoire due to civil unrest and crime.
Country Summary: Violent crimes, such as carjacking, street mugging, assaults, and rape do occur. These crimes often happen at night and in isolated locations. Sexual assault, such as rape, is significantly underreported and remains a serious problem. While domestic violence is criminal under Ghanian law, police rarely respond to reports of domestic violence.
- In urban areas and crowded markets
- When traveling by private or public transportation after dark as criminal elements may use blockades to slow down and restrict movement of vehicles
Ghanaian law contains prohibitions on “unnatural carnal knowledge” – generally interpreted as any kind of sexual intimacy – between persons of the same sex, though in practice, the law is largely used to target men. Punishments can include fines and/or incarceration of up to three years. Rhetoric and violence targeting individuals on the basis of sexual orientation have increased in recent years. Individuals have reported safety incidents that include targeted assault, rape, mob attacks, and harassment due to their sexual orientation.
Read the country information page for additional information on travel to Ghana.
If you decide to travel to Ghana:
Areas Near the Northern Border in the Upper East Region, Upper West Region, and western area of the Savannah Region – Level 3: Reconsider Travel
U.S. citizens in Ghana should reconsider travel to the northern border areas near Burkina Faso and Côte d’Ivoire due to civil unrest and crime. Due to the risks, U.S. government employees working in Ghana must obtain special authorization to travel to the Upper West Region, the Upper East Region, the North East Region, and the western area of the Savannah Region. The U.S. government has limited ability to provide emergency services to U.S. citizens in these areas. Be sure to read the Burkina Faso Travel Advisory here.
Local police may lack the resources to respond effectively to more serious crimes.
Visit our website for Travel to High-Risk Areas.
Date Issued: Thu, 23 Oct 2025
There were no changes to the advisory level or risk indicators. Advisory summary was updated.
Advisory Summary
- Exercise normal precautions in Greece.
- Petty crime is common, especially in popular tourist locations. Stay aware of your surroundings.
- Large-scale demonstrations related to the local political situation may occur with little notice. Demonstrations may disrupt transportation and other essential services.
If you decide to travel to Greece:
Date Issued: Tue, 29 Oct 2024
Updated to reflect a new separate travel advisory from the Kingdom of Denmark.
Exercise increased caution in Greenland due to environmental hazards posed by extreme weather conditions and limited emergency services.
Country Summary: The U.S. government’s ability to provide consular services to U.S. citizens in Greenland is extremely limited.
Greenland’s landscape includes vast stretches of territory remote from cities and settlements. The weather can be harsh, and resources to provide emergency services in areas distant from cities and large settlements, including search and rescue, are scarce. In some areas, search and rescue efforts could take several days to reach the site of an incident.
Read the country information page for additional information on travel to Greenland.
If you decide to travel to Greenland:
- Obtain comprehensive travel, medical, and evacuation insurance; see our webpage for more information on insurance coverage abroad.
- Travel with a professional guide or organization, such as those that are a member of the Association of Arctic Expedition Cruise Operators, or, if organizing a private expedition, be self-sufficient.
- Enroll in the Smart Traveler Enrollment Program (STEP) to receive security messages and make it easier to locate you in an emergency.
- Prepare a contingency plan for emergency situations. Review the Traveler’s Checklist.
- Understand Greenland is a self-governing part of the Kingdom of Denmark. Greenland has assumed responsibility for the administration of health, education, taxation, and family and social matters (among other competencies), meaning these matters are handled differently than in Denmark.
- Follow the Department of State on Facebook and X/Twitter.
- Visit the CDC page for the latest Travel Health Information related to your travel.
Date Issued: Mon, 05 Jan 2026
The advisory level was increased to 2. The “crime” risk indicator was added. Areas of increased risk were removed. Advisory summary was updated.
Exercise Increased Caution in Grenada due to risk of crime.
Advisory summary
Violent crime can occur anywhere in Grenada. American citizens in Grenada have been victims of armed robbery, assault, burglary, and rape. In some cases, American citizens have been killed. Police response times are not as fast as one may expect in the United States.
If you decide to travel to Grenada:
- Review our information on Crime Abroad and for Victims of Crime.
- Do not physically resist any robbery attempt.
- Use caution when walking or driving at night.
- Keep a low profile.
- Stay aware of your surroundings.
- Do not answer your door at your hotel or residence unless you know who it is.
- University students: Contact campus security in the event of an on-campus emergency. Security staff may respond more quickly than local police.
- Boaters: Use caution if unfamiliar people or watercraft approach your boat, whether at anchor or at sea.
- Enroll in the Smart Traveler Enrollment Program (STEP) to get important updates and alerts from the U.S. embassy or consulate. Enrolling helps the U.S. embassy or consulate contact you or your emergency contact in an emergency.
- Review the Country Security Report.
- Visit the Centers for Disease Control and Prevention (CDC) website for the latest Travel Health Information for Grenada.
- Whether you’re a first time or frequent traveler, use the International Travel Checklist.
- We highly recommend that you buy travel insurance before you travel. Check with your travel insurance provider about evacuation assistance, medical insurance, and trip cancelation coverage.
Date Issued: Mon, 30 Dec 2024
Reissued after periodic review with minor edits.
Reconsider travel to Guatemala due to crime. Some areas have higher risks. Please read the full Travel Advisory.
Do not travel to:
- San Marcos Department (except the city of San Marcos) due to crime.
- Huehuetenango Department (except the city of Huehuetenango) due to crime.
- Zone 18 in Guatemala City and the city of Villa Nueva due to crime.
Country Summary: Some areas of Guatemala have problems with gangs, robbery, carjacking, drug trafficking and violence. Local law enforcement may not always respond well to serious crimes, leading to low arrest and conviction rates. While tourists are not usually targeted, they can still be victims of opportunistic crimes.
Guatemala has a program called the Tourist Assistance Program (ASISTUR) that helps protect tourists. ASISTUR works with tourist police (DISETUR) in popular areas like Antigua, Lake Atitlán, Tikal, Quetzaltenango, Puerto Barrios, and Coban. They also have an emergency call center that speaks both Spanish and English. Tourist groups can request a security escort if they have safety concerns. You can call them anytime by dialing 1500 from a Guatemalan phone number or (502) 2290-2810, and you can also reach them on WhatsApp at +502-5188-1819.
U.S. government employees and their families cannot travel to the San Marcos Department, Huehuetenango Department, Zone 18 in Guatemala City, or Villa Nueva. They can travel to other parts of Guatemala and visit popular places like Tikal, Antigua, Lake Atitlán, and the Pacific coast areas in the Santa Rosa and Escuintla. However, they should avoid driving outside Guatemala City at night because of poor lighting and safety risks. They may not use white car taxis or public transportation, like “chicken buses” due to the high chance of crime and injury.
Check the country information page for helpful information about traveling to Guatemala. This includes information on entry and exit rules, safety, local laws, health, and getting around. Also, visit the U.S. Embassy in Guatemala City’s website for local resources, like legal help, medical services, driver’s licenses, and information on residence and work permits, as well as rules about bringing weapons into Guatemala.
If you decide to travel to Guatemala:
- Do not travel outside Guatemala City at night because the roads are poorly lit, and there is a high risk for serious traffic accidents.
- When visiting Lake Atitlán, use certified tour guides and travel between villages by chartered boat. The paths around the lake can be dangerous and hard to access. Emergency services cannot arrive quickly to help.
- Avoid swimming in the Pacific Ocean because the currents and undertow are very strong, and there are not many lifeguards.
- Never leave drinks unattended in bars and restaurants and say no to invitations from strangers to private parties.
- Consider staying in hotels that have secure parking, doormen, and professional security staff.
- Use trusted taxi services like Taxis Amarillo Express, Taxi Seguro, or Uber, and only use INGUAT-approved taxis from the “SAFE” stand at the airport, hotel taxis, or vetted private drivers. Avoid public transport and white car taxis, as well as “chicken buses.”
- Do not hike trails or volcanoes without a qualified local guide, as robberies can happen and getting help can be difficult.
- Avoid using public ATMs, and do not show signs of wealth like wearing expensive watches or jewelry. Also, try not to use your phone in public.
- Check the Overseas Security Advisory Council’s (OSAC) Country Security Report for Guatemala.
- Review the Traveler’s Checklist and make a plan for emergencies.
- Visit the CDC page for the latest Travel Health Notice and Yellow Book on Guatemala.
- Sign up for the Smart Traveler Enrollment Program (STEP) to receive alerts while in Guatemala and help others find you in case of an emergency.
- Follow the U.S. Embassy in Guatemala on Facebook and X(Twitter) for updates.
San Marcos Department – Level 4: Do Not Travel
U.S. government personnel and their families may not go to the San Marcos Department for personal travel, except for the city of San Marcos itself. There is a lot of drug trafficking in this area, and many parts are controlled by drug gangs. Some towns do not have enough police, and local officers may not have the resources to handle serious crimes.
Visit our website for Travel to High-Risk Areas.
Huehuetenango Department – Level 4: Do Not Travel
U.S. government personnel and their families may not go to Huehuetenango Department for personal travel, except for the city of Huehuetenango itself. There is a lot of drug trafficking in this area, and many parts are controlled by drug gangs. Some towns do not have enough police, and local officers may not have the resources to handle serious crimes.
Visit our website for Travel to High-Risk Areas.
Zone 18 in Guatemala City and the city of Villa Nueva – Level 4: Do Not Travel
U.S. government personnel and their families are not allowed to travel to or through Zone 18 in Guatemala City and the city of Villa Nueva due to increased risk of crime and significant gang activity. Aside from Zone 18 and Villa Nueva, U.S. government personnel and their family members are permitted to travel throughout Guatemala City, even at night.
Visit our website for Travel to High-Risk Areas.
Date Issued: Thu, 12 Dec 2024
Updated to reflect change in Travel Advisory from a Level 3 to a Level 2 and removing the “E” (time-limited event) indicator related to the catastrophic 2023 fuel depot explosion and its after-effects.
Exercise increased caution in Guinea due to crime, civil unrest, and inadequate health infrastructure.
Country Summary: There is considerable risk of crimes of opportunity in Guinea, especially in Conakry, such as pickpocketing, purse snatching, theft of valuables from vehicles, assaults, and residential burglaries. Travelers should be especially alert in crowded areas where people congregate, such as markets.
Demonstrations and protests occur unpredictably in Guinea and occasionally result in violence. If traveling outside the Conakry peninsula, make all efforts to complete your travel before nightfall. There are increased safety hazards and security concerns at night. U.S. government employees under Chief of Mission authority are restricted from traveling between cities after dark and are unable to provide emergency services at night.
Guinea’s health infrastructure is inadequate. Health services, hygiene, and quality control do not meet U.S. standards of care. Local drinking water is unsafe, pharmacies are not well regulated, locally available medications may be unsafe, and necessary healthcare may not be available.
Read the country information page for additional information about travel to Guinea.
- If you decide to travel to Guinea:
- Use caution when walking or driving at night.
- Do not physically resist any robbery attempt.
- Do not display signs of wealth, such as expensive watches or jewelry.
- Avoid demonstrations and crowds.
- Obtain comprehensive medical insurance that includes medical evacuation.
- Visit the CDC page for the latest Travel Health Information related to your travel.
- Always carry a copy of your U.S. passport and visa (if applicable). Keep original documents in a secure location.
- Enroll in the Smart Traveler Enrollment Program (STEP) to receive Alerts and make it easier to locate you in an emergency.
- Follow the Department of State on Facebook, Instagram, and X.
- Review the Country Security Report for Guinea.
- Prepare a contingency plan for emergency situations. Review the Traveler’s Checklist.
Date Issued: Thu, 11 Dec 2025
There were no changes to the advisory level. The “Crime” indicator was removed. The “Other” indicator was added. The advisory summary was updated.
Reconsider travel to Guinea-Bissau due to unrest, inadequate health infrastructure, and landmines.
Advisory Summary
There is no U.S. embassy or consulate in Guinea-Bissau. The U.S. government has limited ability to provide emergency services to U.S. citizens. Consular services are provided by the U.S. embassy in Dakar, Senegal.
Unrest
Guinea-Bissau has had periods of political instability for decades, including political unrest in November 2025. Large-scale demonstrations related to the local political situation may occur with little notice. Demonstrations may disrupt transportation and other essential services.
Health
Guinea-Bissau’s health infrastructure is inadequate. Health services, hygiene, and quality control do not meet U.S. standards of care. Pharmacies are not well regulated. Locally available medications are limited and may be unsafe. Even a minor health issue may require medical evacuation at your own expense.
Landmines
Landmines and unexploded ordnance from prior conflicts exist throughout Guinea-Bissau. Areas of greatest risk are Bafata, Oio, Biombo, Quinara, and Tombali. The locations of landmines and unexploded ordnance are often not known, marked, or easy to recognize.
If you decide to travel to Guinea-Bissau:
- Review our information on Travel to High-Risk Areas.
- Have a plan to leave in an emergency that does not depend on U.S. government help. Review our information on Crisis and Evacuations.
- Be aware of your surroundings.
- Do not physically resist any robbery attempt.
- Avoid demonstrations and crowds.
- Use caution when walking or driving at night.
- Refer to our list of medical providers.
- Make sure your insurance includes medical evacuation coverage.
- Do not visit locations where landmines are known to exist. Be alert to signs that mark unexploded landmines. Stay on main roads and do not travel at night.
- Enroll in the Smart Traveler Enrollment Program (STEP) to get important updates and alerts from the U.S. embassy or consulate. Enrolling helps the U.S. embassy or consulate contact you or your emergency contact in an emergency.
- Review the Country Security Report for Guinea-Bissau.
- Visit the Centers for Disease Control and Prevention (CDC) website for the latest Travel Health Information for Guinea-Bissau, including which vaccines are recommended prior to your travel.
- Whether you’re a first time or frequent traveler, use the International Travel Checklist.
- We highly recommend that you buy travel insurance before you travel. Check with your travel insurance provider about evacuation assistance, medical insurance, and trip cancelation coverage.
Date Issued: Mon, 12 May 2025
Reissued after periodic review with minor changes.
Reconsider travel to Guyana due to crime.
Country Summary: Violent crime, including murder and armed robbery, is common, especially at night. Local police often lack the resources to respond effectively to serious criminal incidents.
Read the country information page for additional information on travel to Guyana.
If you decide to travel to Guyana:
- Be extra vigilant when visiting banks or ATMs.
- Be aware of your surroundings.
- Avoid walking or driving at night.
- Do not physically resist any robbery attempt.
- Do not display signs of wealth, such as wearing expensive watches or jewelry.
- Enroll in the Smart Traveler Enrollment Program (STEP) to receive security messages and make it easier to locate you in an emergency.
- Review the Country Security Report for Guyana.
- Visit our website for Travel to High-Risk Areas.
- Prepare a contingency plan for emergency situations. Review the Traveler’s Checklist.
- Visit the CDC page for the latest Travel Health Information related to your travel and return to the United States.
- We highly recommend that you buy insurance before you travel. Check with your travel insurance provider about evacuation assistance, medical insurance, and trip cancellation coverage.
Date Issued: Tue, 15 Jul 2025
Reissued after addition of terrorism indicator.
Do not travel to Haiti due to kidnapping, crime, terrorist activity, civil unrest, and limited health care. Read the entire Travel Advisory.
Country Summary: In July 2023, the Department of State ordered nonemergency U.S. government employees and their family members to leave the country due to security risks.
Haiti has been under a State of Emergency since March 2024. Crimes involving firearms are common in Haiti. They include robbery, carjackings, sexual assault, and kidnappings for ransom. Do not travel to Haiti for any reason.
Kidnapping
Kidnapping is widespread. U.S. citizens have been victims and have been hurt or killed. Kidnappers may:
- Plan with precision or target victims during unexpected times.
- Target and attack convoys.
- Demand ransoms. U.S. victims’ families have paid tens to hundreds of thousands of dollars to rescue their family members.
Demonstrations
Protests, demonstrations, and roadblocks are common and unpredictable. They often damage or destroy infrastructure and can become violent. Mob killings and public assaults are on the rise. People are targeting those they think have committed crimes.
Toussaint Louverture International Airport
Exchanges of gunfire with criminal gangs, organized crime, and terrorists have occurred in the neighborhood just outside the Port-au-Prince International Airport (PAP). Travelers are sometimes followed and violently attacked and robbed shortly after leaving the airport, or while entering or leaving hotels in Port-au-Prince. U.S. commercial flights do not currently operate to and from Port-au-Prince. The Federal Aviation Administration (FAA) issued a Notice to Airmen (NOTAM) prohibiting U.S. air carrier flights to Port-au-Prince due to the ongoing instability. Please check FAA’s website for more information.
Crime and Terrorism
There is widespread violent crime and organized crime in the country, and local law enforcement has limited ability to respond to serious crimes. Violent crime is rampant in Haiti, especially in Port-au-Prince, where the expansion of gang, organized crime, and terrorist activity has led to widespread violence, kidnappings, and sexual assault. The escalation of clashes between armed groups has led to a rise in sporadic gunfire incidents. There is a substantial risk of being struck by stray bullets, even for individuals not directly involved in the violence.
There is risk of terrorist violence, including attacks and other violent gang activity in Haiti. There are gangs that are designated as terrorist organizations present in Haiti.
Transportation and Travel
Do not cross the border by land between Haiti and the Dominican Republic. There is a risk of kidnapping and violence. These dangers are present on roads from major Haitian cities to the border. The U.S. Embassy cannot help you enter the Dominican Republic by air, land, or sea. U.S. citizens who cross into the Dominican Republic at an unofficial crossing may face high immigration fines when they try to leave.
The U.S. Coast Guard has concerns about security in the ports of Haiti. Until those are addressed, the Coast Guard advises mariners and passengers traveling through the ports of Haiti to exercise caution.
Limited Emergency Response
The U.S. government is very limited in its ability to help U.S. citizens in Haiti. Local police and first responders often do not have enough resources. This limits their ability to respond to emergencies or serious crimes. Shortages of gasoline, electricity, medicine, and medical supplies are common throughout the country. Public and private clinics, as well as hospitals, have untrained staff and lack basic resources. Medical providers almost always require upfront payment in cash.
U.S. government employees must follow a nightly curfew. Families of Embassy personnel are not allowed to accompany them on their assignment. Embassy personnel cannot travel by foot in Port-au-Prince. U.S. government employees working in Haiti must obtain special permission to travel outside the embassy compound due to security risks. They are also prohibited from:
- Using any kind of public transportation or taxis.
- Visiting banks and using ATMs.
- Driving at night.
- Traveling anywhere after dark.
Read the country information page for additional information on travel to Haiti.
If you decide to travel to Haiti:
- Avoid demonstrations and crowds.
- Check local media for breaking events. Be prepared to adjust your plans.
- Arrange airport transfers and hotels in advance, or have your host meet you upon arrival.
- Keep travel documents up to date and easily accessible.
- Have evacuation plans that do not rely on U.S. government assistance.
- Bring enough supply of over the counter and prescription medicines.
- If you are being followed as you leave the airport, drive to the nearest police station immediately.
- Develop a communication plan with family or your employer or host organization (if you are traveling on business). This is so they can monitor your safety and location as you travel through high-risk areas. Specify how you will confirm you are safe (text, calls, etc.), how often, and who you will contact first to share the information.
- Choose one family member to serve as the point of contact. They will communicate with kidnappers or hostage-takers, media, U.S. and host country government agencies, and members of Congress if you are kidnapped or taken hostage.
- Establish a proof of life protocol with your loved ones. This is so that if you are taken hostage, your loved ones can know specific questions (and answers) to ask the hostage-takers to be sure that you are alive (and to rule out a hoax).
- Draft a will and designate appropriate insurance beneficiaries and/or power of attorney, put your financial affairs in order.
- Discuss a plan with loved ones regarding care/custody of children, pets, property, belongings, non-liquid assets (collections, artwork, etc.), funeral wishes, etc.
- Leave DNA samples with your medical provider in case it is necessary for your family to access them.
- Travel by vehicle to reduce walking in public.
- Travel in groups or at least do not travel alone.
- Always keep vehicle doors locked, and windows closed when driving. Roadblocks may be operated by gangs, members of organized crime, or terrorists seeking money and may turn violent.
- Be cautious and alert. This is especially important when driving through markets and other crowded areas.
- Do not physically resist any robbery attempt.
- Visit our website for Travel to High-Risk Areas.
- Enroll in the Smart Traveler Enrollment Program (STEP) to receive messages and alerts from the U.S. Embassy and make it easier to locate you in an emergency.
- Review the Country Security Report on Haiti.
- Prepare a plan for emergency situations. Review the Traveler’s Checklist.
- Visit the CDC’s page for the latest Travel Health Information related to your travel and return to the United States.
- We highly recommend that you buy insurance before you travel. Check with your travel insurance provider about evacuation assistance, medical insurance, and trip cancellation coverage.
- Follow the Department of State on Facebook and X.
- Review the Country Security Report on Haiti.
- Visit our website for Travel to High-Risk Areas.
Date Issued: Tue, 10 Dec 2024
Reconsider travel to Honduras due to crime. Read the entire Travel Advisory.
Do not travel to:
- Gracias a Dios Department, most eastern department, due to crime.
Country Summary: Violent crime, such as homicide, armed robbery, and kidnapping, remains common. Violent gang activity, such as extortion, violent street crime, rape, narcotics, and human trafficking, is widespread. Local authorities may lack sufficient resources to respond effectively to serious crime incidents. Around resort areas in the Bay Islands, which include Roatan, Utila, and Guanaja, there is a concentration of resources, and these areas are better policed.
Demonstrations occur regularly throughout the country and can be about a variety of political or economic issues. Protests, demonstrations, tire burnings, and roadblocks are frequent, unpredictable, and can turn violent. They can shutdown roads and highways, often without prior notice or estimated reopening timelines.
In December 2022, the Government of Honduras declared a “State of Exception” in response to high levels of extortion and other crimes. The declaration remains in effect and has been modified to include more cities. It allows the police to suspend constitutional rights in 226 of the country’s 298 municipalities.
The Honduran Ministry of Health declared in June 2024 a national emergency in Honduras due to an increase in dengue cases. The Ministry of Health has carried out dengue prevention, control, and surveillance activities, along with the promotion of preventive measures through the media and educational campaigns. It also carried out clean-up operations and campaigns, including the use of chemical and biological agents for vector control.
Please review the U.S. Centers for Disease Control and Prevention (CDC) website and CDC Global Dengue for further information.
Read the country information page for additional information on travel to Honduras.
If you decide to travel to Honduras:
- Avoid demonstrations.
- Be aware of your surroundings.
- Avoid walking or driving at night.
- Do not physically resist any robbery attempt.
- Be extra vigilant when visiting banks or ATMs.
- Do not display signs of wealth, such as wearing expensive watches or jewelry.
- Do not take public transportation, including white car taxis. U.S. government personnel and their family members are prohibited from using these forms of transportation.
- Monitor local media for breaking events and be prepared to adjust your plans.
- Visit our website for Travel to High-Risk Areas.
- Enroll in the Smart Traveler Enrollment Program (STEP) to receive Alerts and make it easier to locate you in an emergency.
- Follow the Department of State on Facebook and X/Twitter.
- Review the Country Security Report for Honduras.
- Prepare a contingency plan for emergency situations. Review the Traveler’s Checklist.
- Visit the CDC page for the latest Travel Health Information related to your travel.
Gracias a Dios Department – Level 4: Do Not Travel
U.S. government personnel and family members are restricted from traveling to Gracias a Dios, the most eastern department. The department is an isolated region with high levels of criminal activity. Narcotics trafficking is widespread, and large portions of the department are particularly vulnerable to drug trafficking organizations. Infrastructure is weak, government services are limited, and police and military presence is scarce.
Visit our website for Travel to High-Risk Areas
Date Issued: Wed, 27 Nov 2024
Exercise increased caution due to the arbitrary enforcement of local laws.
Summary: Hong Kong SAR authorities have dramatically restricted civil liberties since the Government of the People’s Republic of China (PRC) imposed the Law of the PRC on Safeguarding National Security in the Hong Kong SAR on June 30, 2020. Following the Hong Kong SAR government’s enactment of its own Safeguarding National Security Ordinance on March 23, 2024, Hong Kong SAR authorities are expected to take additional actions to further restrict civil liberties.
The 2020 National Security Law outlines a broad range of vaguely defined offenses, such as acts of secession, subversion, terrorism, and collusion with foreign entities. The 2024 Safeguarding National Security Ordinance builds on this framework with additional vaguely defined offenses, such as treason, insurrection, theft of state secrets, sabotage against public infrastructure, and external interference. According to the legislation, these offenses are applicable to foreign nationals within the Hong Kong SAR and to individuals, including U.S. citizens and permanent residents, located outside its borders. Under these provisions, anyone who criticizes the PRC and/or Hong Kong SAR authorities may face arrest, detention, expulsion, and/or prosecution. Hong Kong SAR authorities are attempting to enforce these provisions against individuals, including U.S. citizens and permanent residents, residing outside their jurisdiction by offering cash rewards for information leading to their arrests in the Hong Kong SAR.
Dual nationality: The Hong Kong SAR government does not recognize dual nationality. Dual U.S.-PRC citizens and U.S. citizens of Chinese descent may be subject to additional security and harassment. If you are a dual U.S.-PRC citizen and enter Hong Kong SAR on a U.S. passport, and you are detained or arrested, PRC authorities are under an obligation to notify the U.S. Embassy or a U.S. Consulate General of your detention and to allow U.S. consular officials to have access to you. In reality, however, U.S. consular officers may be prevented from providing consular assistance, even to those who have entered on their U.S. passports. For more information, visit Consular Protection and Right of Abode in HK(SAR) for Dual Nationals – U.S. Consulate General Hong Kong & Macau.
Demonstrations: Participating in demonstrations or other activities that authorities interpret as constituting an act of secession, subversion, terrorism, or collusion with a foreign country could result in criminal charges under the 2020 National Security Law and/or the 2024 Safeguarding National Security Ordinance. Be aware of your surroundings and avoid demonstrations.
If you decide to travel to the Hong Kong SAR:
- Enter the Hong Kong SAR on your U.S. passport and keep it with you.
- Read the travel information page for the Hong Kong SAR.
- Enroll in the Smart Traveler Enrollment Program (STEP) to receive alerts and make it easier to locate you in an emergency.
- Be aware of your surroundings.
- Avoid demonstrations.
- Exercise caution in the vicinity of large gatherings or protests.
- Avoid taking photographs of protesters or police without permission.
- Keep a low profile.
- If you are arrested or detained, ask police or prison officials to notify U.S. Consulate General Hong Kong & Macau immediately.
- Review the China Country Security Report from the Overseas Security Advisory Council.
- Do not consume drugs in the Hong Kong SAR or prior to arriving in the Hong Kong SAR.
- Follow the Department of State on Facebook and Twitter. Follow U.S. Consulate General Hong Kong & Macau on Facebook and Twitter.
- Visit the Centers for Disease Control and Prevention (CDC) page for the latest Travel Health Information related to the Hong Kong SAR.
- Prepare a contingency plan for emergency situations.
- Review the Traveler’s Checklist.
- Monitor local media, local transportation sites, and apps like MTR Mobile or Citybus for updates.
- Review your flight status with your airline or at the Hong Kong International Airport website.
Date Issued: Wed, 21 Aug 2024
Reissued after periodic review without changes.
Exercise normal precautions in Hungary.
Read the country information page for additional information on travel to Hungary.
If you decide to travel to Hungary:
Date Issued: Thu, 22 Aug 2024
Reissued after periodic review without changes.
Exercise normal precautions in Iceland.
Read the country information page for additional information on travel to Iceland.
If you decide to travel to Iceland:
Date Issued: Mon, 16 Jun 2025
Reissued after periodic review with updates to entry/exit requirements.
Exercise increased caution in India due to crime and terrorism. Some areas have increased risk.
Country Summary: Violent crime and terrorism occur in India.
- Rape is one of the fastest growing crimes in India.
- Violent crimes, including sexual assault, happen at tourist sites and other locations.
- Terrorists may attack with little or no warning. They target:
- tourist locations
- transportation hubs
- markets/shopping malls
- government facilities
The U.S. government has limited ability to provide emergency services to U.S. citizens in rural areas.
- These areas stretch from eastern Maharashtra and northern Telangana through western West Bengal.
- Due to the risks, U.S. government employees working in India must obtain special authorization to travel to these areas.
If you decide to travel to India:
- Do not bring a satellite phone or GPS device. Possessing a satellite phone or GPS device is illegal in India and may result in a penalty of $200,000 or jail time of up to three years.
- Do not travel alone, especially if you are a woman. Read travel tips at Women Travelers.
- Review your personal security plans and stay alert to your surroundings.
- Enroll in the Smart Traveler Enrollment Program (STEP) to get alerts and make it easier for us to find you in an emergency.
- Review the India Country Security Report from the Overseas Security Advisory Council (OSAC)
- Prepare a contingency plan for emergency situations. Review the Traveler’s Checklist.
- Visit the CDC page for the latest Travel Health Information related to your travel and return to the United States.
- We highly recommend that you buy insurance before you travel. Check with your travel insurance provider about evacuation assistance, medical insurance, and trip cancellation coverage.
Union territory of Jammu and Kashmir:
Do not travel to this area (except for visits to the eastern Ladakh region and its capital, Leh) due to terrorism and civil unrest.
- Terrorist attacks and violent civil unrest are possible. Violence happens sporadically in this area and is common along the Line of Control (LOC) between India and Pakistan.
- Violence also occurs in tourist spots in the Kashmir Valley: Srinagar, Gulmarg, and Pahalgam.
- The Indian government does not allow foreign tourists to visit certain areas along the LOC.
- Visit our website for Travel to High-Risk Areas.
India-Pakistan Border
Do not travel to this area due to potential for armed conflict.
- India and Pakistan have a strong military presence on their respective sides of the border.
- The only official border crossing for non-citizens of India or Pakistan is in Punjab. It is between Attari, India, and Wagah, Pakistan.
- The border crossing is usually open. Check the status before you travel.
- To enter Pakistan, you need a Pakistani visa.
- Only U.S. citizens residing in India may apply for a Pakistani visa in India. Otherwise, apply for a Pakistani visa in your home country before traveling to India.
- Visit our website for Travel to High-Risk Areas.
Parts of Central and East India:
Do not travel to this area due to terrorism.
- Maoist extremist groups, or “Naxalites,” are active in a large area of India that spans from eastern Maharashtra and northern Telangana through western West Bengal.
- Attacks against officers of the Indian government continue to occur sporadically in the rural parts of Chhattisgarh and Jharkhand that border with Telangana, Andhra Pradesh, Maharashtra, Madhya Pradesh, Uttar Pradesh, Bihar, West Bengal, and Odisha. Southwest areas of Odisha are also affected.
- The Naxalites have carried out many terrorist attacks, targeting local police, paramilitary forces, and government officials.
- Visit our website for Travel to High-Risk Areas.
Due to the changing nature of the threat, U.S. government employees working in India are required to obtain permission prior to traveling to most areas in the states of:
- Bihar
- Jharkhand
- Chhattisgarh
- West Bengal
- Meghalaya
- Odisha
Permission is not required if employees are traveling only to the capital cities of these states.
U.S. government employees working in India also need approval to travel to the eastern region of Maharashtra and the eastern region of Madhya Pradesh.
U.S. citizens are advised not to cross the India-Nepal border by land due to the risk for immigration related detention and fines.
- Violations of Indian immigration laws are taken very seriously. India may imprison, fine, or deny entry to travelers without valid documents or the correct type of visa.
- Electronic visas are not accepted for land border crossings into India. Even those with physical visas have faced issues, including detention and hefty court expenses, due to misunderstandings over permitted travel and durations of stay.
- If you choose to cross the India-Nepal land border, be advised to use caution and obey all immigration requirements.
Manipur
Do not travel to Manipur due to the threat of violence and crime.
- Ongoing ethnic-based conflict has resulted in reports of extensive violence and community displacement.
- Attacks against Indian government targets occur on a regular basis.
- U.S. government employees working in India require prior approval before visiting Manipur.
- Visit our website for Travel to High-Risk Areas.
Northeastern states
Reconsider travel to this area due to terrorism and violence.
- Ethnic insurgent groups occasionally commit acts of violence in parts of the northeast.
- These incidents include bombings of buses, trains, rail lines, and markets.
- There have been no recent reports of violence in Assam, Nagaland, Arunachal Pradesh, Mizoram, Sikkim, or Tripura.
- U.S. government employees working in India require prior approval before visiting the states of Sikkim, and Arunachal Pradesh, as well as when visiting any areas outside of the capital cities of Assam, Mizoram, Nagaland, Meghalaya, and Tripura.
- Visit our website for Travel to High-Risk Areas.
Date Issued: Wed, 30 Apr 2025
Reissued after periodic review with minor edits.
Exercise increased caution in Indonesia due to terrorism and natural disasters. Some areas have increased risk. Read the entire Travel Advisory.
Do Not travel to:
- The provinces of Central Papua (Papua Tengah) and Highland Papua (Papua Pegunungan) due to civil unrest.
Country Summary: Terrorists continue plotting possible attacks in Indonesia. Terrorists may attack with little or no warning, targeting police stations, places of worship, hotels, bars, nightclubs, markets/shopping malls, and restaurants. Visit the U.S. Department of State’s country reports on terrorism to learn more.
Natural disasters such as earthquakes, tsunamis, or volcanic eruptions may result in disruptions to transportation, infrastructure, sanitation, and the availability of health services.
Demonstrations occur frequently and have the potential to become violent. Avoid demonstrations and crowds.
Read the country information page for additional information on travel to Indonesia.
If you decide to travel to Indonesia:
Central Papua and Highland Papua– Level 4: Do Not Travel
In Central Papua and Highland Papua, violent demonstrations and conflict could result in injury or death to U.S. citizens. Avoid demonstrations and crowds. Armed separatists may kidnap foreign nationals.
Due to the risks, the U.S. government has limited ability to provide emergency services to U.S. citizens in Central Papua and Highland Papua because U.S. government employees working in Indonesia must obtain special authorization before traveling to those areas.
Visit our website for Travel to High-Risk Areas.
Date Issued: Fri, 05 Dec 2025
Do not travel
to Iran due to the risk of terrorism, unrest, kidnapping, arbitrary arrest of U.S. citizens, and wrongful detention. Read the entire Travel Advisory.
Do not travel to Iran for any reason. U.S. citizens in Iran should leave immediately. There is no U.S. Embassy in Iran. Review our information on Travel to High-Risk Areas.
U.S. citizens in Iran face serious dangers including terrorism, unrest, kidnapping, arbitrary arrest, and wrongful detention. Some U.S. nationals have been held for years on false charges, subjected to torture, and even sentenced to death.
The U.S. government does not have diplomatic or consular relations with the Islamic Republic of Iran. The Swiss government, acting through its Embassy in Tehran, serves as the protecting power for United States interests in Iran.
As of October 15, 2025, routine consular services are no longer available for U.S. citizens in Iran. This includes acceptance of applications for full-validity passports and Consular Reports of Birth Abroad (CRBA), and for fee-based notarial services. This change reinforces the travel advice to U.S. citizens: Do Not Travel to Iran.
The Swiss Protecting Power will continue to provide emergency services to U.S. citizens, including acceptance of emergency passport applications, Consular Report of Death Abroad applications, emergency financial assistance, assistance to detained U.S. nationals, and welfare and whereabouts checks for U.S. citizens when security conditions permit.
For routine consular services, U.S. citizens should visit the nearest U.S. embassy or consulate or return to the United States.
The U.S. Department of State has determined that U.S. nationals are at serious risk of wrongful detention by the Government of Iran:
- Iranian authorities continue to unjustly detain U.S. nationals without warning or any evidence they committed a crime. This includes dual U.S.-Iranian nationals, students, journalists, business travelers, academics, and people with U.S. military or government experience. Charges include espionage and posing a threat to national security.
- U.S. nationals are at significant risk of questioning, arrest, and detention in Iran.
- Having a U.S. passport or connections to the United States can be reason enough for Iranian authorities to detain someone.
- Iranian law allows authorities to punish individuals for “collaboration with a hostile state.” This includes having any real or perceived connection with a government or organization that Iranian authorities consider as acting against Iranian interests.
- Prior travel to Israel by an Iranian citizen can result in a prison sentence of two to five years.
- Review our information on U.S. Citizens Missing Abroad and for Victims of Crime.
- Some U.S. citizens have been detained for several months or more. Offenders can face many years in prison.
- The Government of Iran has imposed exit bans on U.S. citizens that prevent travelers from leaving.
- Iran will not recognize your U.S. citizenship if you are a dual U.S.-Iranian citizen or have a claim to Iranian citizenship.
- Iran will not permit Swiss consular officers to visit detained U.S. citizens who also hold Iranian citizenship.
- Demonstrations are common and unpredictable. They may take place in response to political or economic issues. They may also occur on significant holidays and during large events.
- Past demonstrations have turned violent.
- Have a plan to leave in an emergency that does not depend on U.S. government help. Review our information on Crisis and Evacuations.
Companies providing surrogacy services in Iran are misrepresenting the security situation. They downplay the risks of the unregulated surrogacy tourism industry:
- Private companies that organize these visits and services put U.S. citizens in danger.
- Iranian surrogacy providers have also been known to misrepresent U.S. citizenship law.
- A child born abroad to a surrogate will not automatically acquire U.S. citizenship if they are not genetically or gestationally linked to a U.S. citizen parent or their spouse. This means the child cannot get a U.S. passport to leave Iran.
The Federal Aviation Administration (FAA) has issued a Notice to Airmen (NOTAM) or a Special Federal Aviation Regulation (SFAR). This is due to risks to civil aviation operating within or nearby Iran. For more information U.S. citizens should consult the Federal Aviation Administration’s Prohibitions, Restrictions and Notices.
Date Issued: Thu, 17 Jul 2025
Updated to reflect the lifting of ordered departure of non-emergency U.S. government personnel.
Do not travel to Iraq due to terrorism, kidnapping, armed conflict, civil unrest, and the U.S. government’s limited ability to provide emergency services to U.S. citizens in Iraq. Do not travel to Iraq for any reason.
Country Summary: U.S. citizens in Iraq face high risks, including violence and kidnapping. Terrorist and insurgent groups regularly attack Iraqi security forces and civilians. Anti-U.S. militias threaten U.S. citizens and international companies. Attacks using improvised explosive devices, indirect fire, and unmanned aerial vehicles occur in many areas, including major cities. The Department of State requires U.S. government personnel in Iraq to live and work under strict security due to serious threats.
There is risk of terrorist violence, including terrorist attacks and other activity in Iraq. Visit the U.S. Department of State’s country reports on terrorism to learn more.
Demonstrations, protests, and strikes occur frequently throughout the country. These events can develop quickly without prior notice, often interrupting traffic, transportation, and other services, and sometimes turn violent.
Do not travel near armed groups or Iraq’s northern borders due to:
- Continued threat of attacks by terrorist groups
- Armed conflict
- Aerial bombardment
- Civil unrest
U.S. citizens should not travel through Iraq to engage in armed conflict in Syria, where they would face extreme personal risks (kidnapping, injury, or death) and legal risks (arrest, fines, and expulsion). The Kurdistan Regional Government in Iraq has stated it will impose prison sentences of up to ten years on individuals who illegally cross the Iraq-Syria border. Fighting on behalf of or providing other forms of support to designated terrorist organizations can constitute the provision of material support to a foreign terrorist organization, which is a crime under U.S. law that can result in penalties including prison time and large fines. Read the Syria Travel Advisory for more information.
Because of security concerns, U.S. government personnel in Baghdad are prohibited from using Baghdad International Airport.
The Federal Aviation Administration (FAA) has issued a Notice to Airmen (NOTAM) and a Special Federal Aviation Regulation (SFAR) due to risks to civil aviation operating within or in the vicinity of Iraq. For more information, U.S. citizens should consult the Federal Aviation Administration’s Prohibitions, Restrictions, and Notices.
Read the country information page for additional information on travel to Iraq.
If you decide to travel to Iraq:
- Establish a personal security plan in coordination with your employer or host organization or consider consulting with a professional security organization.
- Draft a will and designate appropriate insurance beneficiaries and/or power of attorney.
- Leave DNA samples with your medical provider in case it is necessary for your family to access them for identification purposes.
- Have departure plans that do not rely on U.S. government assistance.
- Discuss a plan with loved ones regarding care/custody of children, pets, property, belongings, non-liquid assets (collections, artwork, etc.), funeral wishes, etc.
- Share important documents, login information, and points of contact with loved ones so that they can manage your affairs if you are unable to return to the United States as planned.
- Visit our website for Travel to High-Risk Areas.
- Enroll in the Smart Traveler Enrollment Program (STEP) to receive alerts from the U.S. Embassy and make it easier to contact you in an emergency.
- Review the Country Security Report for Iraq.
- Visit the CDC website for the latest Travel Health Information related to your travel and return to the United States.
- Prepare a contingency plan for emergency situations. Review the Traveler’s Checklist.
- We highly recommend that you buy insurance before you travel. Check with your travel insurance provider about evacuation assistance, medical insurance, and trip cancellation coverage
Date Issued: Wed, 28 Aug 2024
Reissued after periodic review without changes.
Exercise normal precautions in Ireland.
Read the country information page for additional information on travel to Ireland.
If you decide to travel to Ireland:
Date Issued: Sun, 13 Jul 2025
Updated to reflect the termination of authorized departure status for family members of U.S. government personnel and some non-emergency personnel.
In response to security incidents and without advance notice, the U.S. Embassy may further restrict or prohibit U.S. government employees and their family members from traveling to certain areas of Israel, the Old City of Jerusalem, and the West Bank.
Reconsider Travel To:
- Israel due to terrorism and civil unrest
- West Bank due to terrorism and civil unrest
Do Not Travel To:
- Gaza due to terrorism and armed conflict and within 11.3 km/7 miles of the Gaza Periphery
- Northern Israel within 4 kilometers/2.5 miles of the Lebanese and Syrian borders due to continued military presence and activity
- The Egyptian border within 2.4km/1.5 miles, except for the Taba crossing, which is open
Country Summary: Terrorist groups, lone-actor terrorists and other violent extremists continue plotting possible attacks in Israel, the West Bank, and Gaza. Terrorists and violent extremists may attack with little or no warning, targeting tourist locations, transportation hubs, markets/shopping malls, and local government facilities. The security environment is complex and can change quickly, and violence can occur in Israel, the West Bank, and Gaza without warning. Increased regional tensions can cause airlines to cancel and/or curtail flights into and out of Israel.
Some areas have increased risk. Read the country information page for additional information on travel to Israel, the West Bank, and Gaza.
Visit the CDC page for the latest Travel Health Information related to your travel.
If you decide to travel to Israel, the West Bank, and Gaza:
- Visit our website for Travel to High-Risk Areas.
- Check the most recent Alerts at the Embassy website for the latest information on travel in all of these areas.
- Maintain a high degree of situational awareness and exercise caution at all times, especially at checkpoints and other areas with a significant presence of security forces.
- Avoid demonstrations and crowds.
- Follow the instructions of security and emergency response officials.
- Beware of and report suspicious activities, including unattended items, to local police.
- Learn the location of the nearest bomb shelter or other hardened shelter. Download the Home Front Command Red Alert application or similar apps for mobile devices (available on devices within Israel) to receive real time alerts for rocket and missile attacks and armed UAV intrusions. U.S. government employees in Israel are encouraged to use these apps.
- Obtain comprehensive travel medical insurance that includes medical evacuation prior to travel. Most travel insurance packages do not cover mental health related illnesses/care.
- Enroll in the Smart Traveler Enrollment Program (STEP) to receive Alerts and make it easier to locate you in an emergency.
- Follow the Department of State on Facebook and X/Twitter.
- Review the Country Security Report for Israel, the West Bank, and Gaza.
- Prepare a contingency plan for emergency situations. Review the Traveler’s Checklist.
- When traveling in rural areas, exercise caution given the possibility of unexploded ordnance.
Israel – Reconsider Travel (see below for additional information regarding areas near the Lebanese and Syrian borders)
Reconsider travel due to terrorism, and civil unrest.
The security situation in Israel, including Tel Aviv and Jerusalem is unpredictable, and U.S. citizens are reminded to remain vigilant and take appropriate steps to increase their security awareness as security incidents, including mortar and rocket fire and armed UAV intrusions and missiles, can take place without warning.
U.S. government employees in Israel under Chief of Mission security responsibility are currently restricted from personal travel to the following locations:
- Within 11.3 kilometers/seven miles of the Gaza demarcation line; and
- Northern Israel within 4 kilometers/2.5 miles of the Lebanese and Syrian border due to continued military presence and activity
Any official travel of U.S. government personnel within these areas requires approval from the Embassy’s security office.
Additional travel restrictions may be imposed on U.S. government employees under Chief of Mission security responsibility, with little to no notice due to increased security issues or threats.
Northern Israel (within 4 kilometers/2.5 miles of Lebanese and Syrian borders) – Do Not Travel
The Israeli authorities restrict travel to areas close to the border given the Israeli Defense Forces continued presence and activity. Do not travel to this area for any reason.
Due to the risks, U.S. government employees working in Israel are currently restricted from personal travel within 4 kilometers/2.5 miles of the Lebanese and Syrian borders. Due to the risks, U.S. government employees working in Israel must obtain special authorization to travel close to these borders.
The U.S. Embassy strongly recommends that U.S. citizens not travel within 4 kilometers/2.5 miles of the Lebanese and Syrian borders.
West Bank – Reconsider Travel
Reconsider Travel due to terrorism and civil unrest.
Due to the risks, U.S. government employees working in Israel must obtain special authorization travel to the West Bank. U.S. government employees are currently restricted from all personal travel to the West Bank, except:
- U.S. government employees can use Routes 1, 90, and 443 at any time.
- U.S. government employees are permitted personal daylight travel to Jericho and Bethlehem, including Beit Jala and Beit Sahour. Given continued closures of checkpoints throughout the West Bank, the only permitted and accessible route into Bethlehem for U.S. government employees and their family members is through Checkpoint 300 near Rachel’s Tomb.
Over the past several months, there has been an increase in violence, Israeli military operations, and terrorist attacks. Some incidents have resulted in injury or death of U.S. citizens. During periods of unrest, the Israeli government may restrict access to and within the West Bank, and some areas may be placed under curfew.
Additional travel restrictions may be imposed on U.S. government employees working in Israel with little to no notice due to increased security issues or threats.
Visit our website for Travel to High Risk Areas.
Gaza – Do Not Travel
Do not travel for any reason due to terrorism and armed conflict.
The U.S. government is unable to provide routine or emergency consular services to U.S. citizens in Gaza as U.S. government employees are prohibited from traveling there. The security environment within Gaza and on its borders is extremely dangerous and volatile. The pedestrian crossing between Gaza and Israel (Erez Crossing) was damaged on October 7, 2023, and remains closed. The pedestrian crossing between Egypt and Gaza (Rafah Crossing) has been closed since May 7, 2024, and remains closed to the general public.
If a U.S. citizen or Lawful Permanent Resident (LPR) desires our assistance and has not already provided their information to the Department of State, please email U.S. Embassy Jerusalem at [email protected].
Visit our website for Travel to High Risk Areas.
If you decide to travel to Gaza:
- Be prepared for an indefinite stay as the crossings between Gaza with Israel and Egypt can close without advance notice and for long periods during times of unrest and armed conflict. This includes having food, supplies, and medicine for an extended or indefinite period.
- Have a plan for entering and departing Gaza that does not rely on U.S. government assistance.
- If you use assistive or medical devices that require a power supply, be sure to find backup power or other ways that will sustain your device or equipment without access to power.
- Draft a will and designate appropriate insurance beneficiaries and/or power of attorney.
- Discuss a plan with loved ones regarding care/custody of children, pets, property, belongings, non-liquid assets (collections, artwork, etc.), funeral wishes, etc.
- Leave DNA samples with your medical provider in case it is necessary for your family to access them.
Please be sure to visit our website for Crisis and Disaster Abroad: Be Ready for information that may be helpful.
Date Issued: Fri, 23 May 2025
Exercise increased caution in Italy due to terrorism.
Advisory summary: There is risk of terrorist violence, including terrorist attacks and other activity in Italy. Visit the U.S. Department of State’s country reports on terrorism to learn more.
Terrorists may attack with little or no warning. Common targets include:
- Tourist spots
- Transportation centers
- Shopping malls and markets
- Local government buildings
- Hotels, clubs and restaurants
- Religious sites
- Parks
- Sporting and cultural events
- Schools
- Airports
- Public areas
If you decide to travel to Italy:
Date Issued: Sat, 17 Jan 2026
The advisory level was decreased to Level 2. There were no changes to the risk indicators. The advisory summary was updated.
Exercise Increased Caution due to crime, health, and natural disaster risks. Some areas have increased risk. Read the entire Travel Advisory.
Advisory Summary
U.S. government employee travel restrictions
U.S. government employees working in Jamaica are not allowed to use public buses or drive between cities at night. They are also not allowed to travel to certain high-risk areas, as noted below.
U.S. citizens in Jamaica should take the same precautions.
Natural disaster
Jamaica continues to recover from Hurricane Melissa, which made landfall there on October 28, 2025. The hurricane caused widespread damage to the western part of the island. Some areas are still experiencing post-storm impacts on infrastructure and services.
- All major airports have reopened for commercial flights.
- Some areas in the western part of Jamaica, such as Black River and Montego Bay, are in varying stages of recovery from the hurricane. Exercise increased caution if traveling to affected areas at this time.
- Confirm availability of services and amenities at your destination before you travel to Jamaica.
Crime
- Violent crime is a risk throughout Jamaica. The homicide rate reported by the Government of Jamaica is among the highest in the Western Hemisphere.
- Tourist areas generally see lower rates of violent crime than other parts of the country.
- Armed robberies and sexual assaults are common.
- The U.S. embassy routinely receives reports of sexual assaults, including from U.S. citizen tourists at resorts.
- U.S. citizens report slow or unsatisfactory response to serious criminal incidents.
- When arrests are made, cases are often not prosecuted to a final verdict and sentence.
Health
Basic and specialized medical care may not be available in many parts of Jamaica. This includes slower emergency service response times and less availability of care for illness or injury.
- Health care facilities in western Jamaica were badly damaged by Hurricane Melissa.
- Private hospitals require payment up front before admitting patients. They may not be able to provide specialized care.
- Ambulance services are not always staffed with EMTs. They are not always readily available, especially in rural areas.
- U.S. citizens should bring extra prescription medication. Common medications, such as insulin, can be difficult to obtain.
- U.S. Medicare and Medicaid do not apply abroad.
- Most hospitals and doctors abroad do not accept U.S. health insurance.
- Air ambulance service to the United States costs $30,000 on the low end.
- We strongly recommend that you have travel insurance and confirm your coverage. Travel insurance should include medical insurance, evacuation assistance, and other trip coverage.
The Department of State does not pay medical bills.
Level 4 – Do Not Travel
High crime areas
Do Not Travel to high crime areas due to risk of crime.
U.S. government employee travel restrictions
U.S. government employees working in Jamaica are not allowed to travel to the following high-risk areas. U.S. citizens in Jamaica are advised to take the same precautions.
Do not travel to these areas for any reason:
- St. Ann’s Parish – Steer Town and the Buckfield neighborhood near Ocho Rios.
- St. Catherine’s Parish – Spanish Town, Central Village, areas within Portmore, including: Naggo Head, New Land, Old Braeton, Portmore Lane, Gregory Park, and Waterford.
- Clarendon Parish – All of Clarendon Parish, except passing through Clarendon Parish using the T1 and A2 highways.
- St. Elizabeth’s Parish – Vineyard District Community, between the communities of Salt Spring and Burnt Savanna, St. Elizabeth.
- Hanover Parish – Logwood and Orange Bay.
- St. James Parish/Montego Bay – Inland side of the A1 highway and The Queen’s Drive from San San to Harmony Beach Park.
- Kingston and St. Andrew Parish – Cassava Piece, Duhaney Park, Grants Pen, Standpipe, Swallowfield, Elleston Flats, August Town, and downtown Kingston, defined as between Mountain View Avenue and Hagley Park Road, and south of Half Way Tree and Old Hope Roads. Downtown Kingston includes Arnett Gardens, Cockburn Gardens, Denham Town, Olympic Gardens, Seaview Gardens, Trench Town, and Tivoli Gardens.
- Manchester Parish – Green Vale and Gray Ground neighborhoods of Mandeville.
- St. Thomas Parish – Black Lane neighborhood in Seaforth, Grands Penn, Church Corner neighborhood near Yallahs, Town of Yallahs, except when driving through on the main highway.
- Trelawny Parish – Clarks Town.
- Westmoreland Parish – Russia community in Savanna-la-Mar (The Southeastern quadrant of Savannah la Mar east of Darling Street and south of the A2 highway/Barracks Road), Morgan Bay, Kings Valley, The Whitehall, Bethel Town, and Red Ground neighborhoods of Negril.
Visit our website for Travel to High-Risk Areas.
If you decide to travel to Jamaica:
- Review our information on Crime Abroad and for Victims of Crime.
- Do not physically resist any robbery attempt.
- Do not attempt to bring firearms or ammunition. This includes stray rounds, shells, or empty casings. The penalties for carrying firearms or ammunition, even by mistake, are severe, and can include long prison sentences.
- Avoid walking or driving at night.
- Avoid public buses.
- Avoid remote places.
- Stay aware of your surroundings and keep a low profile.
- Have a plan to depart in an emergency that does not depend on U.S. government help. Review our information on Crisis and Evacuations.
- Enroll in the Smart Traveler Enrollment Program (STEP) to get important updates and alerts from the U.S. embassy or consulate. Enrolling helps the U.S. embassy or consulate contact you or your emergency contact in an emergency.
- Review the Country Security Report for Jamaica.
- Visit the Centers for Disease Control and Prevention (CDC) website for the latest Travel Health Information for Jamaica.
- Whether you’re a first time or frequent traveler, use the International Travel Checklist.
- We highly recommend that you buy travel insurance before you travel. Check with your travel insurance provider about evacuation assistance, medical insurance, and trip cancelation coverage.
Date Issued: Thu, 15 May 2025
Reissued after periodic review without changes.
Exercise normal precautions in Japan.
Read the country information page for additional information on travel to Japan.
If you decide to travel to Japan, U.S. citizens should always exercise caution when traveling abroad. Use these general tips to stay safe:
Date Issued: Thu, 18 Dec 2025
The Department of State renewed its Travel Advisory for Jordan on December 18. There was no change to the advisory level. The “other” risk indicator was removed. Advisory summary was updated.
Exercise increased caution in Jordan due to terrorism. Some areas have increased risk. Read the entire Travel Advisory.
Do not travel to:
- Mansheyat al Ghayyath, Ruwayshid, and the border with Syria and Iraq due to the risk of terrorism and unrest.
- Designated Syrian refugee camps in Jordan due to Government of Jordan’s restrictions on entry into these camps.
- Rusayfah city due to the risk of terrorism and crime.
- The Baqa’a neighborhood of Ayn Basha due to risk of terrorism and crime.
Reconsider travel to:
- Ma’an city and designated areas of Ma’an Governorate due to the risk of terrorism and crime.
- Zarqa city due to the risk of terrorism and crime.
Advisory Summary
There is risk of terrorism in Jordan. Terrorists may attack without warning, including such targets as:
- Tourist locations;
- Transportation hubs;
- Markets and shopping malls;
- Local government buildings.
Jordan is relatively stable but due to high tensions in the region, the security environment remains complex and can change quickly.
Mansheyat al Ghayyath, Ruwayshid, and the Border with Syria and Iraq – Level 4: Do Not Travel
Do not travel to the towns of Mansheyat al Ghayyath, Ruwayshid, and Jordan’s border with Syria and Iraq due to the continued threat of cross-border violence, terrorism, and crime.
- All U.S. government personnel must follow U.S. embassy travel restrictions for all official travel within 3.5 km of the Jordan-Syria border. All travel must occur during daylight hours.
- U.S. government personnel must follow U.S. embassy travel restrictions for official travel to the towns of Mansheyat al Ghayyath and Ruwayshid along highway 40 towards the Iraq border. All travel must occur during daylight hours.
- Personal travel by U.S. government employees to these border areas is not authorized.
Level 4: Do Not Travel – Syrian Refugee Camps
Do not travel to Syrian refugee camps in Jordan. This is due to the Government of Jordan’s restrictions on entry into these camps.
All U.S. government personnel on official travel to the following three Syrian refugee camps must follow U.S. embassy travel restrictions:
- Azraq Syrian Refugee Camp, Azraq, Zarqa.
- Za’atari Syrian Refugee Camp, Al Zatryah, Mafraq.
- King Abdullah Park Syrian Refugee Camp, Ramtha, Irbid.
Official U.S. government travel to these camps must occur during daylight hours. Personal travel by U.S. government personnel to these refugee camps is not authorized.
Level 4: Do Not Travel – Rusayfah city
Do not travel to Rusayfah city due to the risk of terrorism and crime.
- All U.S. government personnel on official travel to Rusayfah must follow U.S. embassy travel restrictions. All travel must occur during daylight hours.
- Personal travel by U.S. government personnel to these areas is not authorized.
Level 4: Do Not Travel – The Baqa’a Neighborhood of Ayn Basha
Do not travel to the Baqa’a neighborhood of Ayn Basha due to the risk of terrorism and crime.
- All U.S. government personnel on official travel to these areas must follow U.S. embassy travel restrictions. All travel must occur during daylight hours.
- Personal travel by U.S. government personnel to these areas is not authorized.
Level 3: Reconsider Travel – Zarqa City
Reconsider travel to Zarqa city due to the risk of terrorism and crime.
- All U.S. government personnel on official travel to this area must follow U.S. embassy travel restrictions. When traveling at night, U.S. government personnel on official travel must use major highways.
- Personal travel by U.S. government personnel to these areas is allowed only during daylight hours. Direct transit through these areas is permissible at night along major highways.
Level 3: Reconsider Travel – Ma’an city and some areas of Ma’an Governorate
Reconsider travel to these areas due to the risk of terrorism and crime:
- Ma’an city
- All areas of Ma’an Governorate east of Highway 15 (“The Desert Highway”)
- All areas of Ma’an Governorate within two kilometers to the west of Highway 15
- All U.S. government personnel on official travel to these areas must follow U.S. embassy travel restrictions. When traveling at night, U.S. government personnel on official travel must use major highways.
- Personal travel by U.S. government personnel to these areas is allowed only during daylight hours. Direct transit through these areas is permissible at night along major highways.
Review our information on Terrorism and Travel to High-Risk Areas.
If you decide to travel to Jordan:
- There is a risk of terrorist violence, including terrorist attacks and other activity in Jordan. Visit the U.S. Department of State’s country reports on terrorism to learn more.
- Stay aware of your surroundings.
- Avoid demonstrations and crowds.
- Monitor local media for breaking news. Be prepared to adjust your plans.
- Review local laws and conditions before traveling.
- Enroll in the Smart Traveler Enrollment Program to get important updates and alerts from the U.S. embassy or consulate. Enrolling helps the U.S. embassy or consulate contact you or your emergency contact in an emergency.
- Review the Country Security Report for Jordan.
- Visit the Centers for Disease Control and Prevention (CDC) website for the latest Travel Health Information for Jordan.
- Whether you’re a first time or frequent traveler, use the International Travel Checklist.
- We highly recommend that you buy travel insurance before you travel. Check with your travel insurance provider about evacuation assistance, medical insurance, and trip cancelation coverage.
Date Issued: Mon, 05 Aug 2024
Reissued after periodic review without changes.
Exercise normal precautions in Kazakhstan.
Read the country information page for additional information on travel to Kazakhstan.
If you decide to travel to Kazakhstan:
Date Issued: Mon, 17 Mar 2025
Updated to include a risk indicator for health and to reflect additional safety and security information.
Do Not Travel to:
- Kenya-Somalia border counties (Garissa, Wajir, Mandera), Tana River County, and coastal areas north of Malindi due to terrorism and kidnapping;
- West Pokot and western Turkana County due to banditry;
- Parts of Marsabit and Turkana Counties within 30 miles (50 kilometers) of the Ethiopian border due to cross-border incursions.
Reconsider Travel to:
- The Nairobi neighborhoods of Eastleigh and Kibera due to crime and kidnapping.
Country Summary: Violent crime, such as armed carjacking, mugging, home invasion, and kidnapping, can occur at any time. Local police often lack the capability to respond effectively to serious crimes and terrorist attacks. Emergency medical and fire services are limited. Avoid traveling after dark in Kenya due to crime and poor traffic safety.
Crime
Motorycle crimes are common, where thieves grab items from victims and are able to quickly flee the scene. Crimes typically occur in crowded areas or when people are distracted. Police have limited ability to respond to these crimes. Handbags, mobile phones, and other easy-to-reach valuables are the most stolen items.
Terrorism
Terrorist attacks have occurred with little or no warning. They have targeted:
- Kenyan and foreign government buildings,
- Tourist locations,
- Transportation hubs,
- Hotels and resorts,
- Markets and shopping malls, and
- Places of worship.
Terrorist acts have included armed assaults, suicide operations, bomb or grenade attacks, and kidnappings.
Demonstrations
Demonstrations, strikes, and other political and economic protests are common. They often block key intersections or highways, resulting in widespread traffic jams. Violence during demonstrations has occurred across the country. This includes rock-throwing and police using deadly force. Political violence is most common in western Kenya and Nairobi.
Health
Access to medical care in Kenya is limited and medical facilities may not have adequate supply of medicine, especially outside large cities. Medical evacuation insurance valid for travel to Kenya is strongly recommended. Hospitals usually require payment before treatment.
Unlicensed facilities and bribes
Some schools and behavior modification facilities in Kenya operate without licensing and oversight. Reports of U.S. citizens being held against their will or being physically abused in these facilities are common. The embassy has also received numerous reports from young adults whose U.S. passports were taken away by their families.
The embassy frequently receives complaints from U.S. citizens about being stopped by police or immigration or customs officials asking for bribes.
Property confiscations
Property disputes are common and can turn violent. Some U.S. citizens have had their property confiscated or been threatened.
Read the country information page for additional information about travel to Kenya.
If you decide to travel to Kenya:
- Stay alert in locations frequented by tourists.
- Do not resist any robbery attempt.
- Check local media for breaking events and prepare to adjust your plans.
- Make backup plans to leave the country. Always carry a copy of your U.S. passport and entry stamp. Keep original documents in a secure location.
- Enroll in the Smart Traveler Enrollment Program (STEP) to receive security messages and make it easier to locate you in an emergency.
- Review the Country Security Report for Kenya.
- Prepare a plan for emergency situations. Review the Traveler’s Checklist.
- Visit the CDC page for the latest Travel Health Information related to your travel.
- We highly recommend that you buy insurance before you travel. Check with your travel insurance provider about evacuation assistance, medical insurance, and trip cancellation coverage.
Specified Areas – Level 4: Do Not Travel
Due to the risks, U.S. government employees working in Kenya are prohibited from traveling to:.
Kenya-Somalia Border Counties:
- Mandera due to kidnapping and terrorism.
- Wajir due to kidnapping and terrorism.
- Garissa due to kidnapping and terrorism.
Coastal Areas Countries:
- Tana River (except Tsavo National Park) due to kidnapping and terrorism.
- Lamu county due to kidnapping and terrorism.
- Kilifi north of Malindi due to kidnapping and terrorism.
Parts of north and northwestern Kenya:
- West Pokot County due to banditry
- Western Turkana County south of Lodwar due to banditry
- Parts of Marsabit and Turkana Counties within 30 miles (50 kilometers) of the Ethiopian border due to cross-border incursions
Do not travel to these areas for any reason.
Specified Areas – Level 3: Reconsider Travel
Nairobi neighborhoods of Eastleigh and Kibera:
- Crime and kidnappings occur in the Eastleigh and Kibera neighborhoods. Violent crime, such as armed carjacking, mugging, and home invasion, can occur at any time. Street crime can involve multiple armed assailants. Most roads in these areas are heavily congested and overcrowded. Local police often lack the resources and training to respond effectively to serious criminal incidents.
Visit our website for Travel to High-Risk Areas.
Date Issued: Mon, 02 Dec 2024
Reissued after periodic review without changes.
Exercise normal precautions in Kiribati.
Read the country information page for additional information on travel to Kiribati.
Commercial transportation to/from Kiribati is sporadically available.
If you decide to travel to Kiribati:
Date Issued: Mon, 02 Dec 2024
Last Update: Reissued after periodic review with minor edits
Exercise increased caution due to terrorism. Some areas have increased risk. Read the entire Travel Advisory.
Reconsider Travel To:
North Mitrovica, Leposavic, Zubin Potok, and Zvecan. Due to ethnic tensions, these areas have a potential risk for civil unrest.
Country Summary: Terrorist groups continue plotting attacks in the Balkans region, including Kosovo. Terrorists may attack with little or no warning.
They may target:
- High-profile public events (sporting contests, political rallies, demonstrations, holiday events, celebratory gatherings, etc.)
- Hotels, clubs, and restaurants frequented by tourists
- Places of worship
- Schools
- Parks
- Tourism infrastructure
- Shopping malls and markets
- Public transportation systems (including subways, buses, trains, and scheduled commercial flights)
Read the country information page for additional information on travel to Kosovo.
If you decide to travel to Kosovo:
North Mitrovica, Leposavic, Zubin Potok, and Zvecan – Level 3: Reconsider Travel
Recent unrest has been politically related. While it has not impacted tourists or members of the international community, there is a risk that bystanders can be affected.
The U.S. government has limited ability to provide emergency services to U.S. citizens in the north of Kosovo as U.S. government employee travel to North Mitrovica, Leposavic, Zubin Potok, and Zvecan is restricted.
Visit our website for Travel to High-Risk Areas
Date Issued: Tue, 08 Apr 2025
Reissued after periodic review with minor edits.
Exercise normal precautions in Kuwait. Some areas have higher risks. Read this whole Travel Advisory.
- Exercise increased caution in the Jleeb Al-Shuyoukh area in Kuwait City because of crime.
- Do not travel to the desert area near the border with Iraq because of bombs, shells, and landmines left over from the 1990 Gulf War.
The Federal Aviation Administration (FAA) has issued a Notice to Airmen (NOTAM) or a Special Federal Aviation Regulation (SFAR). This is due to risks to civil aviation from political and military tensions in the Persian Gulf and the Gulf of Oman region, including Kuwait. The notice advises U.S. operators to review current security and threat information and to report safety or security incidents. For more information, U.S. citizens should consult the Federal Aviation Administration.
Read the country information page for additional information on travel to Kuwait.
If you decide to travel to Kuwait:
- Review local laws and conditions before traveling. Kuwait has strict laws prohibiting the possession or trafficking of drugs (including marijuana) and alcohol. Do not bring drugs or alcohol in your luggage and do not attempt to purchase them in Kuwait.
- Be aware of your surroundings.
- Stay alert in places visited by large groups of people and travelers or tourists.
- Keep travel documents up to date and easy to access.
- Make back-up plans to leave the country.
- Sign up for the Smart Traveler Enrollment Program (STEP) to get alerts from the embassy. It makes it easier for us to contact you in an emergency.
- Follow the Department of State on Facebook and X.
- Read the Country Security Report for Kuwait.
- Visit the CDC page for the latest Travel Health Information before you travel.
- You should make a safety plan for emergencies. Read the Traveler’s Checklist.
- We highly recommend that you buy insurance before you travel. Check with your travel insurance provider about evacuation assistance, medical insurance, and trip cancelation coverage.
- Visit our website for Travel to High-Risk Areas.
Desert Area North of the Mutla’a Ridge and Near the Border with Iraq – Level 4: Do Not Travel
Desert areas and some beaches north of the Mutla’a Ridge still have unexploded bombs, shells, and landmines left over from the 1990 Gulf War. Avoid areas that are “off the beaten path” and do not touch or move objects in that area. They could explode. These locations are not clearly marked, or the signs might be difficult to understand. Do not travel to these areas for any reason.
Jleeb Al-Shuyoukh Neighborhoods – Level 2: Exercise Increased Caution
The Kuwaiti police report that the neighborhood of Jleeb Al-Shuyoukh near the Kuwait International Airport is a high-crime area.
Date Issued: Mon, 21 Apr 2025
Reissued after periodic review with edits to the area of higher risk in the border region with Tajikistan.
Exercise normal precautions in the Kyrgyz Republic. Some areas have increased risk. Read the entire Travel Advisory.
Exercise increased caution in:
- The border region with Tajikistan.
Read the country information page for additional information on travel to the Kyrgyz Republic.
If you decide to travel to the Kyrgyz Republic:
- Monitor local media for breaking events and be prepared to adjust your plans.
- Keep travel documents up to date and easily accessible.Have evacuation plans that do not rely on U.S. government assistance.
- ·Enroll in the Smart Traveler Enrollment Program (STEP) to receive messages and Alerts from the U.S. Embassy to make it easier to locate you in an emergency.
- Review the Crime and Safety Report for the Kyrgyz Republic.
- Prepare a contingency plan for emergency situations. Review the Traveler’s Checklist.
- Visit the CDC page for the latest Travel Health Information related to your travel.
We highly recommend that you buy insurance before you travel. Check with your travel insurance provider about evacuation assistance, medical insurance, and trip cancellation coverage.
Border Region with Tajikistan – Level 2: Exercise Increased Caution
Exercise increased caution to areas within approximately 30 kilometers of the border with Tajikistan. The March 13, 2025, signing and subsequent ratifying of a bilateral agreement between Kyrgyzstan and Tajikistan have facilitated the resumption of cross-border movement, but the situation remains fluid. As of March 2025, two checkpoints on the border are open for transit. There are no travel restrictions for Americans crossing the border. However, visitors to the Batken region (especially the Batken and Leilek districts) should exercise caution and remain vigilant due to a recent history of border clashes.
U.S. government employees working in the Kyrgyz Republic are restricted from traveling to the Batken province without prior authorization from the U.S. Embassy in Bishkek.
Date Issued: Thu, 21 Nov 2024
Reissued after periodic review with minor changes.
Exercise increased caution to Laos due to civil unrest. Some areas have increased risk. Read the entire Travel Advisory.
Reconsider travel to:
- Xaisomboun Province due to civil unrest.
Exercise increased caution in:
- Remote areas along the border with Burma due to crime.
- Areas of Savannakhet, Xieng Khouang, Saravane, Khammouane, Sekong, Champassak, Houaphan, Attapeu, Luang Prabang, and Vientiane provinces, as well as along Route 7 (from Route 13 to the Vietnam border), Route 9 (Savannakhet to the Vietnam border), and Route 20 (Pakse to Saravane) due to unexploded bombs.
Read the country information page for additional information on travel to Laos.
If you decide to travel to Laos:
Xaisomboun Province – Level 3: Reconsider Travel
There is a continued threat of violence in Xaisomboun Province.
The U.S. government has limited ability to provide emergency services to U.S. citizens in Xiasomboun Province as U.S. government employees must obtain special authorization to travel there.
Visit our website for Travel to High-Risk Areas.
Areas on the Border with Burma – Level 2: Exercise Increased Caution
Bandits, drug traffickers, and other people pursuing illegal activities operate in these areas, as do armed groups opposed to the Burmese government.
Areas of Savannakhet, Xieng Khouang, Saravane, Khammouane, Sekong, Champassak, Houaphan, Attapeu, Luang Prabang, and Vientiane provinces, as well as along Route 7 – Level 2: Exercise Increased Caution
There are large numbers of unexploded bombs in these areas left over from the Indochina War.
Date Issued: Mon, 26 Aug 2024
Reissued after periodic review without changes.
Exercise normal precautions in Latvia.
Read the country information page for additional information on travel to Latvia.
If you decide to travel to Latvia:
Date Issued: Thu, 03 Jul 2025
Updated to reflect the lifting of ordered departure of family members and non-emergency U.S. government personnel.
Do Not Travel to Lebanon due to crime, terrorism, civil unrest, kidnapping, unexploded landmines, and the risk of armed conflict. Some areas, especially near the borders, have increased risk. Read the entire Travel Advisory.
U.S. Embassy Beirut personnel are restricted from personal travel without advance permission. Additional travel restrictions may be imposed on U.S. personnel under Chief of Mission security responsibility, with little to no notice due to increased security issues or threats.
Commercial flights are available, but at reduced capacity. Please check flight options at Beirut–Rafic Hariri International Airport.
Country Summary: U.S. citizens in Lebanon should be aware that consular officers from the U.S. Embassy are not always able to travel to assist them. The Department of State considers the threat to U.S. government personnel in Beirut serious enough to require them to live and work under strict security. The internal security policies of the U.S. Embassy may be adjusted at any time and without advance notice.
Since October 8, 2023, cross-border exchanges of fire have occurred between Hizballah and Israel. In some instances, targets have been well north of the border region. A cessation of hostilities between Israel and Lebanon went into effect on November 27, and implementation is ongoing; however, there are continued instances of military activity in some areas of Lebanon. The Lebanese government cannot guarantee the safety of U.S. citizens against sudden outbreaks of violence and armed conflict. Family, neighborhood, or sectarian disputes can escalate quickly and can lead to gunfire or other violence with no warning.
Terrorist groups continue plotting possible attacks in Lebanon. Terrorists may conduct attacks with little or no warning targeting tourist locations, transportation hubs, markets/shopping malls, and local government facilities.
Local security authorities have noted a rise in violent crimes, including political violence. Multiple unsolved killings in Lebanon may have been politically motivated.
Kidnapping, whether for ransom, political motives, or family disputes, has occurred in Lebanon. Suspects in kidnappings may have ties to terrorist or criminal organizations.
Unexploded landmines and explosive remnants of war are a hazard along the border with Syria. Heed land mine warning signs. Do not venture off the road into areas marked off with red and white plastic tape. Avoid roadside ditches, shoulders, and unmarked trails. Never touch anything resembling unexploded munitions.
U.S. citizens should avoid demonstrations and exercise caution if in the vicinity of any large gatherings or protests as these have the potential to turn violent quickly and with little notice. Protesters have blocked major roads, including thoroughfares between downtown Beirut and the area where the U.S. Embassy is located, and between Beirut and Beirut-Rafic Hariri International Airport.
Read the country information page for additional information on travel to Lebanon.
If you decide to travel to Lebanon:
- Visit our website for information on Travel to High-Risk Areas.
- Appoint one family member to serve as the point of contact with kidnappers/hostage-takers, media, U.S. and host country government agencies, and members of Congress if you are kidnapped, or taken hostage.
- Keep travel documents up to date and easily accessible.
- Do not touch unknown metal objects and avoid traveling off well-used roads, tracks, and paths due to risk of unexploded ordnance.
- Avoid demonstrations and crowds.
- Stay alert in locations frequented by Westerners.
- Monitor local media for breaking events and adjust your plans based on new information.
- Enroll in the Smart Traveler Enrollment Program (STEP) to receive Alerts and make it easier to locate you in an emergency.
- Follow the Department of State on Facebook and X/Twitter.
- Review the Country Security Report for Lebanon.
- Visit the CDC page for the latest Travel Health Information related to your travel.
- U.S. citizens who travel abroad should always have a contingency plan for emergency situations. Review the Traveler’s Checklist.
Southern Lebanon – Level 4: Do Not Travel, Depart If You Are There (See map below)
The U.S. Embassy strongly urges U.S. citizens to avoid southern Lebanon and to depart if you are there; that is, all parts south of the city of Saida, to include inland areas, as illustrated in the map below. There have continued to be instances of military activity in South Lebanon and near the Syrian border since the cessation of hostilities went into effect.
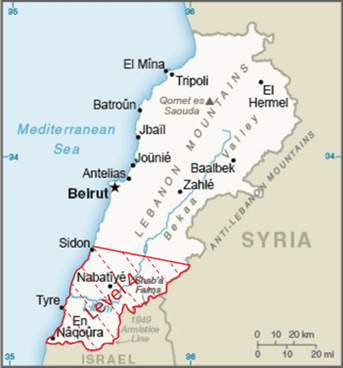
Border with Syria – Level 4: Do Not Travel, Depart If You Are There
The U.S. Embassy strongly urges U.S. citizens to avoid the Lebanon-Syria border and to depart if you are there. This area has seen clashes between Lebanese security forces and Syrian-based groups, as well as recent airstrikes. The U.S. Department of State also warns U.S. citizens of the risk of traveling on flights that fly over Syria, which include some flights to and from Beirut.
Refugee Settlements – Level 4: Do Not Travel, Depart If You Are There
The U.S. Embassy urges U.S. citizens to avoid travel to refugee settlements in Lebanon and depart if you are there. These settlements are prone to outbreaks of violence including shootings and explosions.
Visit our website for Travel to High-Risk Areas.
Date Issued: Tue, 17 Sep 2024
Reissued after periodic review with changes to overall Travel Advisory level from level 1 to level 2 due to an increase in crime.
Exercise increased caution in Lesotho due to crime.
Country Summary: Crime is common in Lesotho and sporadic armed robberies and carjackings occur. Local police may lack the resources to respond in a timely manner to criminal incidents.
Read the country information page for additional information on travel to Lesotho.
If you decide to travel to Lesotho:
Date Issued: Thu, 11 Dec 2025
There was no change to the advisory level. The “health” risk indictor was added. Advisory summary was updated.
Exercise increased caution in Liberia due to crime, unrest, and health.
Advisory summary
Crime
Violent crime, such as armed robbery are common in urban areas, crowded markets, and public beaches. Local police lack the resources to respond effectively to serious crimes.
If traveling outside the capital city of Monrovia, try to finish your trip during daylight hours. It’s safer to avoid travel at night due to safety and security concerns.
Unrest
Demonstrations occur regularly. They have on occasion resulted in violence or use of tear gas by authorities.
Large-scale demonstrations related to the local political situation may
occur with little notice. Demonstrations may disrupt transportation
and other essential services
Health
- The health infrastructure in Liberia is inadequate. Health services, hygiene, and quality control do not meet U.S. standards of care.
- Pharmacies are not well regulated. Locally available medications may be unsafe.
- Medical services for routine and emergency procedures are limited. Health facilities are available in major cities. It may be harder to find adequate health care in rural areas.
- Public medical clinics lack basic resources and supplies.
Review the Health section of the Travel Guidance on this page for more information.
U.S. government employee travel restrictions
- U.S. government employees are prohibited from traveling outside the capital or between counties after dark due to the safety and security risk. The only exception is travel to and from Roberts International Airport.
- U.S. citizens in Liberia are advised to take the same precautions.
If you decide to travel to Liberia:
- Review our information on Crime Abroad and Victims of Crime.
- Review our information on U.S. Citizens Missing Abroad.
- Carry a copy of your passport and visa (if applicable). Leave originals in your hotel safe.
- Do not display signs of wealth, like expensive watches or jewelry.
- Do not physically resist any robbery attempt.
- Monitor local media for breaking news. Be prepared to adjust your plans.
- Keep travel documents up to date and easily accessible.
- Refer to our list of medical providers.
- Make sure your insurance includes medical evacuation coverage.
- Check with your doctor about required vaccines and shots for high-risk exposure to malaria and yellow fever before you go to Liberia.
Bring enough supplies of over the counter and prescription medicines in your carry-on luggage.to cover the duration of the trip.
- Enroll in the Smart Traveler Enrollment Program (STEP) to get important updates and alerts from the U.S. embassy. Enrolling helps the U.S. embassy contact you or your emergency contact in an emergency.
- Review the Overseas Security Advisory Council Country Security Report for Liberia.
- Visit the Centers for Disease Control and Prevention (CDC) website for the latest Travel Health Information for Liberia.
- Whether you are a first time or frequent traveler, use the International Travel Checklist.
- We highly recommend that you buy travel insurance before you travel. Check with your travel insurance provider about evacuation assistance, medical insurance, and trip cancelation coverage.
Date Issued: Wed, 16 Jul 2025
Reissued after periodic review with minor edits.
Do not travel to Libya for any reason due to crime, terrorism, unexploded landmines, civil unrest, kidnapping, and armed conflict. Read entire Travel Advisory.
Country Summary: Terrorism: There is risk of terrorist violence, including terrorist attacks and other activity in Libya. Visit the U.S. Department of State’s country reports on terrorism to learn more. Terrorist attacks could occur with little or no warning, targeting public spaces like tourist locations, hotels, transportation hubs, markets/shopping malls, and government facilities.
Kidnapping is widespread, and victims have included U.S. citizens.
Kidnappers may take advantage of unplanned opportunities. Criminal or armed individuals or groups have threatened to and/or have seized or detained and threatened to kill, injure, or continue to detain individuals in order to compel a third party (including a governmental organization) to do or abstain from doing something as a condition of release.
Unexploded landmines, cluster munitions, and unexploded ammunition are a hazard throughout Libya. Heed land mine warning signs. Do not venture off the road into areas marked with red and white plastic tape. Avoid roadside ditches, shoulders, and unmarked trails. Never touch anything resembling unexploded munitions. Landmines do exist in populated areas due to numerous ground offensives in the last decade.
Outbreaks of violence between competing armed groups can occur with little warning and have the potential to impact U.S. citizens. The capital, Tripoli, and other cities, such as Surman, Al-Jufra, Misrata, Ajdabiya, Benghazi, and Zuwara, have witnessed fighting among armed groups. Hotels and airports frequented by U.S. citizens have been the targets of these attacks. Even demonstrations intended to be peaceful can turn confrontational and escalate into violence.
Armed groups sometimes detain travelers for arbitrary reasons, do not grant detainees access to lawyers or legal processes, and do not allow detainees to inform others of their status. U.S. citizens should carry proof of citizenship and valid immigration status at all times, but having these documents does not guarantee fair treatment.
While there are operational international airports in Libya with regular domestic and international flights, flights are often delayed, rerouted, and cancelled without warning. The U.S. government prohibits U.S. commercial aviation operations within Libyan airspace.
Due to risks to civil aviation operating within or in the vicinity of Libya, the Federal Aviation Administration (FAA) has issued a Notice to Air Missions (NOTAM) and a Special Federal Aviation Regulation (SFAR). For more information U.S. citizens should consult the Federal Aviation Administration’s Prohibitions, Restrictions and Notices.
The Commandant of the U.S. Coast Guard has determined that effective anti-terrorism measures are not in place in Libyan ports and has imposed conditions of entry on vessels that arrive in U.S. ports having visited ports in Libya. Mariners and passengers traveling through the ports of Libya should exercise caution.
U.S. citizens in Libya in need of routine consular services should contact the U.S. Embassy in Tunis, Tunisia for assistance. To contact the U.S. Embassy in Tunis, click here.
U.S. citizens who are in Libya are urged to depart as soon as possible via commercial means if possible.
The Department of State will continue to provide information via the Smart Traveler Enrollment Program (STEP), Embassy Libya’s web page, Travel.State.Gov, Facebook, and X.
Read the country information page for additional information on travel to Libya.
If you decide to travel to Libya:
- Visit our website for Travel to High-Risk Areas.
- Carry proof of citizenship and valid immigration status at all times.
- Avoid demonstrations and crowds.
- Make contingency plans to leave.
- Draft a will and designate appropriate insurance beneficiaries and a power of attorney.
- Discuss a plan with loved ones regarding care or custody of children, pets, property, belongings, non-liquid assets (collections, artwork, etc.), funeral wishes, etcetera.
- Establish your own personal security plan in coordination with your family, and employer or host organization, so that they can monitor your safety and location. This plan should specify whom you would contact first, and how that person should share information.
- Appoint one family member to serve as the point of contact with kidnappers/hostage-takers, media, U.S. and host country government agencies, and members of Congress if you are kidnapped, taken hostage, or detained.
- Consider consulting with a professional security organization.
- Do not touch unknown metal objects and avoid traveling off well-used roads, tracks, and paths due to risk of unexploded ordnance.
- Enroll in the Smart Traveler Enrollment Program (STEP) to receive Alerts and make it easier to locate you in an emergency.
- Review the Country Security Report for Libya.
- Visit the CDC page for the latest Travel Health Information related to your travel.
- U.S. citizens who travel abroad should always have a contingency plan for emergency situations. Review the Traveler’s Checklist.
- We highly recommend that you buy insurance before you travel. Check with your travel insurance provider about evacuation assistance, medical insurance, and trip cancellation coverage.
Date Issued: Thu, 22 May 2025
Reissued after periodic review with minor edits.
Exercise normal precautions in Liechtenstein.
Read the country information page for additional information on travel to Liechtenstein.
If you decide to travel to Liechtenstein:
Date Issued: Fri, 09 Aug 2024
Reissued after periodic review without changes.
Exercise normal precautions in Lithuania.
Read the country information page for additional information on travel to Lithuania.
If you decide to travel to Lithuania:
Date Issued: Fri, 19 Jul 2024
Last Update: Reissued after periodic review with minor edits.
Exercise normal precautions when traveling to Luxembourg.
Read the country information page for additional information on travel to Luxembourg.
If you decide to travel to Luxembourg:
Date Issued: Wed, 27 Nov 2024
Reconsider travel due to a limited ability to provide emergency consular services. Exercise increased caution due to the arbitrary enforcement of local laws.
Summary: The U.S. government has a limited ability to provide emergency services to U.S. citizens in the Macau SAR due to People’s Republic of China (PRC) Ministry of Foreign Affairs travel restrictions on U.S. diplomatic personnel.
Even in an emergency, the PRC Ministry of Foreign Affairs requires all U.S. diplomatic personnel, including those accredited to the Macau SAR, to apply for and receive visas before entering the Macau SAR. This takes at least five to seven days, significantly limiting the U.S. government’s ability to offer timely consular services in the Macau SAR.
Dual nationality: The Macau SAR government does not recognize dual nationality. Dual U.S.-PRC citizens and U.S. citizens of Chinese descent may be subject to additional security and harassment. If you are a dual U.S.-PRC citizen awnd enter the Macau SAR on a U.S. passport, and you are detained or arrested, PRC authorities are under an obligation to notify the U.S. Embassy or a U.S. Consulate General of your detention and to allow U.S. consular officials to have access to you. In reality, however, U.S. consular officials may be prevented from providing consular assistance, even to those who have entered on their U.S. passports. For more information, visit Consular Protection and Right of Above in HK(SAR) for Dual Nationals – U.S. Consulate General Hong Kong & Macau.
Demonstrations: Participating in demonstrations or any other activities that authorities interpret as constituting an act of secession, subversion, terrorism, or collusion with a foreign country could result in criminal charges. Be aware of your surroundings and avoid demonstrations.
If you decide to travel to the Macau SAR:
- Enter the Macau SAR on your U.S. passport and keep it with you.
- Read the travel information page for the Macau SAR.
- Enroll in the Smart Traveler Enrollment Program (STEP) to receive alerts and to make it easier to locate you in an emergency.
- Be aware of your surroundings.
- Avoid demonstrations.
- Exercise caution in the vicinity of large gatherings or protests.
- Avoid taking photographs of protesters or police without permission.
- Keep a low profile.
- If you are arrested or detained, ask police or prison officials to notify U.S. Consulate General Hong Kong & Macau immediately.
- Review the China Country Security Report from the Overseas Security Advisory Council.
- Do not consume drugs in the Macau SAR or prior to arriving in the Macau SAR.
- Follow the Department of State on Facebook and Twitter. Follow U.S. Consulate General Hong Kong & Macau on Facebook and Twitter.
- Visit the Centers for Disease Control and Prevention (CDC) page for the latest Travel Health Information related to the Macau SAR.
- Prepare a contingency plan for emergency situations.
- Review the Traveler’s Checklist.
- Monitor local media and the Macau Government Tourism Office website for updates.
- Review your flight status with your airline or at the Macau International Airport website.
Date Issued: Fri, 05 Dec 2025
Exercise increased caution
to Madagascar due to crime, unrest, and health. Some areas have increased risk.
Crime
Violent crime, such as armed robbery and assault, occurs throughout Madagascar, particularly after dark, in remote areas, and along major national roads in the south and western areas of the country. Petty crime is common, especially in tourist locations. Stay aware of your surroundings.
Unrest
Strikes and other protest activity related to political and economic conditions occur regularly, particularly in periods near elections.
Violent confrontations between the Dahalo (criminal gangs that steal cattle) and security forces have increased in several regions of Madagascar, particularly in areas south and west of the capital.
Health
Medical infrastructure is very limited in populated areas of Madagascar and is extremely limited in rural areas of Madagascar. Serious medical emergencies in Madagascar require medical evacuation. Review the Health section of the Travel Guidance on this page for more information.
Date Issued: Fri, 06 Dec 2024
Reissued after periodic review without changes.
Exercise increased caution in Malawi due to crime and civil unrest.
Country Summary: Violent crime such as theft, burglary, armed robbery, and assault is common. The capabilities of the Malawi Police Service are growing but its resources and abilities to deter and investigate crimes, assist victims, and apprehend criminals are limited.
Demonstrations may occur and increase in frequency due to political issues and events such as elections. Tear gas is frequently deployed at demonstrations and roads may be blocked.
Read the country information page for additional information on travel to Malawi.
If you decide to travel to Malawi:
- Avoid demonstrations and crowds.
- Monitor local media for breaking events and be prepared to adjust your plans.
- Keep travel documents up to date and easily accessible.
- Enroll in the Smart Traveler Enrollment Program (STEP) to receive security messages and make it easier to locate you in an emergency.
- Follow the Department of State on Facebook and X/Twitter.
- Review the Country Security Report for Malawi.
- U.S. citizens who travel abroad should always have a contingency plan for emergency situations. Review the Traveler’s Checklist.
- Visit the CDC page for the latest Travel Health Information related to your travel.
- U.S. citizens are reminded to avoid all gatherings, even peaceful ones, that could turn violent with little or no warning.
Date Issued: Wed, 24 Jul 2024
Reissued after periodic review with minor edits.
Exercise normal precautions in Malaysia. Some areas have increased risk. Read the entire Travel Advisory.
Exercise Increased Caution in:
- The eastern area of Sabah State due to kidnapping.
Read the country information page for additional information on travel to Malaysia.
If you decide to travel to Malaysia:
Eastern Area of Sabah State – Level 2: Exercise Increased Caution
There is a threat of kidnappings-for-ransom from both terrorist and criminal groups. These groups may attack with little to no warning, targeting coastal resorts, island resorts, and boats ferrying tourists to resort islands.
The U.S. government has limited ability to provide emergency services to U.S. citizens in eastern Sabah as U.S. government employees must obtain special authorization to travel to parts of eastern Sabah.
Date Issued: Tue, 07 Oct 2025
Reissued Language: There were no changes to the advisory level or risk indicators. Advisory summary was updated.
Exercise increased caution in Maldives due to terrorism.
Advisory summary
Terrorist groups may attack with little or no warning. They may target:
- Tourist locations
- Transportation hubs
- Markets and shopping malls
- Local government facilities
Attacks may occur on remote islands. This can lengthen the response time of authorities.
If you decide to travel to Maldives:
- There is risk of terrorist violence, including terrorist attacks and other activity in the Maldives. Visit the U.S. Department of State’s country reports on terrorism to learn more.
- Monitor local media for breaking news. Be prepared to adjust your plans.
- Stay aware of your surroundings.
- Avoid demonstrations and crowds.
- Enroll in the Smart Traveler Enrollment Program (STEP) to get important updates and alerts from the U.S. embassy or consulate. Enrolling helps the U.S. embassy or consulate contact you or your emergency contact in an emergency.
- Review the Country Security Report for Maldives.
- Visit the Centers for Disease Control and Prevention (CDC) website for the latest Travel Health Information for the Maldives.
- Whether you’re a first time or frequent traveler, use the International Travel Checklist.
- We highly recommend that you buy travel insurance before you travel. Check with your travel insurance provider about evacuation assistance, medical insurance, and trip cancelation coverage.
Date Issued: Fri, 09 Jan 2026
This Travel Advisory reflects updates in U.S. Embassy Bamako’s posture as of January 9, 2026. On October 30, 2025, the Department of State ordered non-emergency employees and family members to leave Mali due to safety risks. As of January 9, 2026, the Department of State has normalized operations at U.S. Embassy Bamako noting the following conditions.
Do Not Travel to Mali for any reason due to crime, terrorism, kidnapping, unrest and health.
Advisory summary
As of January 9, the Department of State has lifted its ordered departure mandate for non-emergency Embassy employees and their family members.
U.S. government employee travel restrictions
- U.S. government employees working in Mali are not allowed to travel outside of Bamako due to safety risks.
- U.S. citizens in Mali are advised to take the same precautions.
Crime
Violent crime is common throughout Mali. Crimes include kidnapping, assault, armed robbery, home invasion, and carjacking.
Violent crime is a major concern in Bamako especially during local holidays and seasonal events.
- Roadblocks, including by armed groups, occur throughout the country.
- In cities, police checkpoints are possible, especially at night.
- Highways across the country often face attacks on government, civilian, and commercial targets.
Terrorism
There is risk of terrorist violence, including terrorist attacks and other activity in Mali. Visit the U.S. Department of State’s country reports on terrorism to learn more.
Terrorist and armed groups target foreigners to kidnap for ransom.
Terrorists may attack without warning:
- Spots frequented by foreigners anywhere in the country
- Night clubs
- Hotels
- Restaurants
- Places of worship
- International diplomatic missions
- Local security forces and civilians
Kidnapping
The threat of kidnapping of Westerners by criminal or terrorist groups remains high throughout the region. Extortion and kidnapping for ransom are significant sources of financing for terrorist and criminal groups.
Unrest
Periodic street demonstrations occur throughout Mali. Although some are planned and peaceful, demonstrations can occur spontaneously and turn violent. The majority of these are contained by security forces, but U.S. citizens should avoid street demonstrations and always maintain security awareness.
Armed Conflict
Armed conflict between the Malian government and armed groups is common throughout Mali. Many terrorist and separatist armed groups are active throughout the country. These groups may plan and carry out deadly attacks against Malian government and military facilities, including in and around Bamako. Conflict between these groups often results in civilian casualties.
Air Travel
The Federal Aviation Administration (FAA) has issued a Notice to Airmen (NOTAM) and Special Federal Aviation Regulation (SFAR). This is due to risks to civil aviation operating within or nearby Mali.
For more information U.S. citizens should consult the Federal Aviation Administration’s Prohibitions, Restrictions and Notices.
Health
Medical services for routine and emergency procedures are limited. Health facilities are available in major cities. It may be harder to find adequate health care in rural areas.
- Public medical clinics lack basic resources and supplies.
- Patients must cover all costs for transferring to or between hospitals.
- Psychological and psychiatric services are limited, even in larger cities.
- Hospital-based care is only available through government institutions.
- Read the Health section of the Travel Guidance on this page for more information.
For U.S. citizens in Mali:
- The Department of State urges U.S. citizens not to travel to Mali.
- Have a plan to leave in an emergency that does not depend on U.S. government help. Review our information on Crisis and Evacuations.
- Establish your own personal security plan in coordination with your employer or host organization. Consider consulting with a professional security organization.
- Enroll in the Smart Traveler Enrollment Program (STEP) to get important updates and alerts from the U.S. embassy. Enrolling helps the U.S. embassy contact you or your emergency contact in an emergency.
- Review the OSAC Country Security Report (formerly known as the Overseas Security Advisory Council) for Mali.
- Monitor local media for breaking news. Be prepared to adjust your plans.
- Draft a will. Designate appropriate insurance beneficiaries or draft a power of attorney.
- Discuss a plan with loved ones regarding care or custody of children, pets, property, belongings, non-liquid assets (collections, artwork, etc.), funeral wishes, etc.
- Share important documents, login information, and points of contact with loved ones. This helps them manage your affairs if you cannot return to the United States.
- Develop a communication plan with family, your employer, or host organization. This helps them monitor your safety and location as you travel through high-risk areas. Specify how you’ll confirm you’re safe (text, calls, etc.), how often, and who you’ll contact first to share the information.
- Identify key sources of possible help for you and your family in case of emergency, such as the local U.S. embassy or consulate, FBI, the State Department, your employer (if traveling on business), and local friends or family in the high-risk area.
- Choose 1 family member to serve as the point of contact. If you are kidnapped or taken hostage, that person can communicate with kidnappers or hostage-takers, media, U.S. or foreign government agencies, and members of Congress.
- Establish a proof of life protocol with your loved ones. If you are taken hostage, your loved ones will know specific questions (and answers) to ask the hostage-takers to confirm that you are being held captive and alive.
- Leave DNA samples with your medical provider in case it is necessary for your family to access them for identification purposes.
- Use all available safety measures in your home or hotel, always including locking doors and windows, and setting the alarm.
- If asked to stop by police, stop only in well-lit areas or places where several officers are posted.
- Before you travel, delete any sensitive photos, comments, or content that might be seen as controversial or inappropriate in your destination. Do this for your social media accounts, cameras, laptops, phones, and other accounts and devices.
- Leave your expensive or sentimental belongings behind.
- Refer to our list of medical providers.
- Make sure your insurance includes medical evacuation coverage.
- Check with your doctor about required vaccines and shots for high-risk exposure before you go to Mali.
- We highly recommend that you buy travel insurance before you travel. Check with your travel insurance provider about evacuation assistance, medical insurance, and trip cancelation coverage.
- Visit the CDC page for the latest Travel Health Information related to your travel.
- Review our information on Travel to High-Risk Areas, Crime Abroad, Victims of Crime, Terrorism, and U.S. Citizens Missing Abroad
Date Issued: Wed, 28 May 2025
Reissued after periodic review with minor edits.
Exercise normal precautions in Malta.
Read the country information page for additional information on travel to Malta.
If you decide to travel to Malta:
Date Issued: Mon, 16 Jun 2025
Reissued after periodic review with minor edits.
Exercise normal precautions in the Marshall Islands.
Read the country information page for additional information on travel to Marshall Islands.
If you decide to travel to Marshall Islands:
Date Issued: Tue, 15 Jul 2025
Reissued after periodic review with minor edits.
Reconsider travel to Mauritania due to terrorism and crime. Some areas have increased risk. Read the entire Travel Advisory.
Do Not Travel To:
- Areas marked off-limits by the Mauritanian military. These areas are unsafe due to security risks and terrorist activities.
- All areas north of the Tropic of Cancer
- All areas within 100 KM of the Mali and Algeria Border
Country Summary: Violent crimes occur frequently outside the Tevragh Zeina neighborhoods in Nouakchott. They include mugging, armed robbery, and assault. Local police lack the resources to respond quickly and effectively to serious crimes. Transportation options and communication infrastructure are limited outside Nouakchott. little or no warning, targeting places frequented by Westerners.
Terrorism
Terrorist violence is a risk in Mauritania. This includes potential attacks and other activities. Visit the U.S. Department of State’s country reports on terrorism to learn more.
U.S. Travel Limits and Emergency Services
The U.S. government can only offer limited emergency services to U.S. citizens in Mauritania. This is due to travel rules for U.S. government employees, poor infrastructure, and few health facilities, especially outside of Nouakchott.
U.S. government employees can travel outside Nouakchott only during the day. They cannot walk alone outside of specific areas and times. U.S. government employees must get special permission to travel outside Nouakchott. This helps them move smoothly through security checkpoints on major roads.
Read the country information page for additional information on travel to Mauritania.
If you decide to travel to Mauritania:
Areas Designated Off-Limits by the Mauritanian Military – Level 4: Do Not Travel
The government of Mauritania designates certain areas off-limits to foreigners and most Mauritanians. These “No Movement Zones” are very dangerous. They are near Mali, where armed groups are fighting an active insurgency. This violence may spill over the border into Mauritania. The government of Mauritania has little presence in these areas. Police cannot respond to most incidents.
Cell phone coverage and paved roads are nonexistent in these areas. U.S. officials are unable to travel to these places. The boundaries of these areas often change, so stay informed about restricted entry.
Date Issued: Mon, 08 Dec 2025
The advisory level was increased to 2. The “crime” indicator was added. Advisory summary was updated.
Exercise increased caution to Mauritius due to crime.
Advisory summary
Crime
Most crimes against foreigners are crimes of opportunity. This includes pickpocketing, purse snatchings, and petty thefts.
Petty crime occurs in crowded outdoor shopping areas, beaches, and other tourist spots. It also happens near ATMs.
Other serious crimes in Mauritius include:
- Break-ins
- Violent crimes (serious assaults, murder, rape)
- Verbal harassment and other crimes towards women traveling alone
Review our information on Crime Abroad and for Victims of Crime.
If you decide to travel to Mauritius:
- Do not physically resist any robbery attempt.
- Use caution when walking or driving at night.
- Stay aware of your surroundings.
- Do not display signs of wealth, like expensive watches or jewelry.
- Do not answer your door at your hotel or residence unless you know who it is.
- Stay alert in tourist spots.
- Stay alert when visiting banks or ATMs.
- Enroll in the Smart Traveler Enrollment Program (STEP) to get important updates and alerts from the U.S. embassy or consulate. Enrolling helps the U.S. embassy or consulate contact you or your emergency contact in an emergency.
- Review the Country Security Report for Mauritius.
- Visit the Centers for Disease Control and Prevention (CDC) website for the latest Travel Health Information for Mauritius.
- Whether you’re a first time or frequent traveler, use the International Travel Checklist.
- We highly recommend that you buy travel insurance before you travel. Check with your travel insurance provider about evacuation assistance, medical insurance, and trip cancelation coverage.
Date Issued: Tue, 12 Aug 2025
Exercise increased caution in Mexico due to terrorism, crime, and kidnapping.
Advisory summary
- Many violent crimes take place in Mexico. They include homicide, kidnapping, carjacking, and robbery. There is a risk of terrorist violence, including terrorist attacks and other activity in Mexico. Visit the U.S. Department of State’s country reports on terrorism to learn more.
- The U.S. government has limited ability to help in many parts of Mexico. U.S. government employees are not allowed to travel to certain high-risk areas.
- Due to security risks, U.S. citizens should follow the same restrictions as U.S. government employees while traveling.
- Emergency services are limited or unavailable in remote or rural areas.
- If you encounter a road checkpoint, you should comply. Fleeing or ignoring instructions can lead to you being hurt or killed.
- Check the map of restricted areas.
U.S. government employee travel restrictions (U.S. citizens are advised to follow):
- May not travel between cities after dark.
- Must rely on dispatched vehicles from regulated taxi stands or app-based services like Uber or Cabify and may not wave down taxis on the street.
- Should avoid traveling alone, especially in remote areas.
- May not drive between Mexican border cities, the U.S.-Mexico border and the interior of Mexico. There are some limited exceptions.
Risks in specific areas
Level: 4 – Do not travel
State of Colima: Do not travel due to terrorism, crime, and kidnapping.
- There is a risk of violence in the state from terrorist groups, cartels, gangs and criminal organizations.
- Most homicides are targeted assassinations against members of criminal organizations.
- Shooting incidents between criminal groups have injured or killed bystanders.
- U.S. citizens and lawful permanent residents have been victims of kidnapping.
- U.S. government employees may travel to the following areas with the below restrictions:
- Manzanillo: Travel only to the central tourist and port areas of Manzanillo. Primary tourist areas include the historic city center and Malecon, the hotel zone, the Peninsula Santiago or Las Hadas area, and the Club Santiago Peninsula area.
- Travel between Manzanillo and Guadalajara: Travel is permitted only on Highways 54D, 110, and 200D.
- Travel between Manzanillo and Cihuatlán or Jalisco (including to the Manzanillo International Airport): Travel is permitted on Highway 200.
- U.S. government employees may not travel to other areas in the state of Colima.
- Review a map of restricted areas.
State of Guerro: Do not travel due to terrorism and crime.
- There is a risk of violence in the state from terrorist groups, cartels, gangs and criminal organizations.
- Armed groups are active independently of the government in many areas of Guerrero. Members of these groups frequently maintain roadblocks and may use violence towards travelers.
- U.S. government employees may not travel to any area in the state of Guerrero, including tourist areas Acapulco, Zihuatanejo, Taxco, and Ixtapa.
- Review a map of restricted areas.
State of Muchoacan: Do not travel due to terrorism and crime.
- There is a risk of violence in the state from terrorist groups, cartels, gangs and criminal organizations.
- Crime and violence are widespread in Michoacan state.
- U.S. government employees may travel to the following areas with the below restrictions:
- May travel on Federal Highway 15D to transit the state between Mexico City and Guadalajara.
- May travel to Morelia only by air or by land using Federal Highways 43 or 48D from Federal Highway 15D. Travel between the airport and the city is permitted by Highway 48D only.
- Must travel Lazaro Cardenas only by air and limit activities to the city center or port areas.
- May not travel to other areas of the state of Michoacan, including portions of the Monarch Butterfly Reserve located in Michoacan.
- Review a map of restricted areas.
State of Sinaloa: Do not travel due to terrorism and crime.
- There is a risk of violence in the state from terrorist groups, cartels, gangs and criminal organizations.
- U.S. government employees may travel to:
- Mazatlan by air or sea only: Travel is limited to the historic town center from Avenida Gutierrez Najera to the ocean. Travel along the coast (Malecon) from the historic center until Route 503 is permitted. Travel must be via direct routes between these destinations and the airport or sea terminal.
- Los Mochis and Topolobampo by air or sea only: Travel is restricted to the city and the port. Travel must be via direct routes between these destinations and the airport.
- U.S. government employees may not travel to other areas in the state of Sinaloa.
- Review a map of restricted areas.
Sate of Tamaulipas: Do not travel due to terrorism, crime, and kidnapping.
- There is a risk of violence in the state from terrorist groups, cartels, gangs and criminal organizations.
- Organized crime activity is common along the northern border and in Ciudad Victoria. It includes gun battles, murder, armed robbery, carjacking, kidnapping, forced disappearances, extortion, and sexual assault.
- U.S. citizens and lawful permanent residents have been victims of kidnapping.
- Criminal groups target public and private buses, as well as cars traveling through Tamaulipas. Criminals often kidnap passengers for ransom.
- Heavily armed members of criminal groups often patrol the state, especially along the border region from Reynosa to Nuevo Laredo. They act without fear of punishment in these areas, and local law enforcement has limited capacity to respond to crime.
- Law enforcement capacity is greater in the tri-city area of Tampico, Ciudad Madero, and Altamira. These have a lower rate of violent criminal activity compared to the rest of the state.
- Review a map of restricted areas.
State of Matamoros:
- Travel for U.S. government employees is limited to the following areas in Matamoros including the neighborhoods of Jardin and Rio, and the area of the city as defined by:
- The Rio Grande River to the north
- Avenida de Las Americas from the Brownsville and Matamoros Bridge south to Calle Hidalgo and west to Calle Diez
- Diagonal Cuauhtemoc east to Avenida Canales continuing east to Calle Primera
- Avenida Lauro Villar from Calle Primera east to Calle Republica de Cuba
- Calle Republica de Cuba from Avenida Lauro Villar north to Avenida Tamaulipas
- Other permitted areas in Matamoros include the shops and restaurants along any of these routes: Calle Sexta to the Holiday Inn, Plaza Fiesta, the Soriana Market at Calle Primera and Avenida Canales, the Soriana Market at Veteran’s Bridge via Avenida Lauro Villa or Avenida Division del Norte, and the HEB on Avenida Lauro Villar
- An armored vehicle is required for all travel to and from the Matamoros Airport and all travel to Reynosa.
- U.S. government employees have a curfew of midnight to 6am in Matamoros.
Nuevo Laredo:
- Travel to Nuevo Laredo is permitted for U.S. government employees who have approved official travel only. All U.S. government employees on official travel must remain within the Nuevo Laredo boundaries:
- Northern boundary: The Rio Grande River
- Eastern boundary: Boulevard Colosio
- Western boundary: Avenida Cesar Lopez de Lara
- Southern boundary: Calle 15 de Septiembre
- U.S. government employees may not travel by land between cities in Tamaulipas using interior Mexican highways. They must instead travel on the U.S. side of the border.
- Travel between Nuevo Laredo and Monterrey is limited to Federal Highway 85D during daylight hours with prior authorization.
Nuevo Progreso:
- U.S. government employees may travel to Nuevo Progreso within a limited radius of the Progreso-Nuevo Progreso International Bridge in Nuevo Progreso.
- Access to Nuevo Progreso is only permitted via the Progreso Port of Entry in Texas, on foot (no vehicle crossing), between 7am and 6pm.
State of Zacatecas: Do not travel due to terrorism, crime, and kidnapping.
- There is a risk of violence in the state from terrorist groups, cartels, gangs and criminal organizations.
- Violent crime, extortion, and gang activity are widespread in Zacatecas state.
- U.S. citizens and lawful permanent residents have been victims of kidnapping.
- U.S. government employees may travel to Zacatecas city by air only. The permitted areas of Zacatecas City include the city limits and the airport, and Highway 45 between the 2 locations.
- Review a map of restricted areas.
Level: 3 – Reconsider travel
State of Baja California: Reconsider travel due to terrorism, crime, and kidnapping.
- There is a risk of violence in the state from terrorist groups, cartels, gangs and criminal organizations.
- Criminal groups fight for control in border areas. They want to set up routes for narco-trafficking and human smuggling.
- Travelers should remain on main highways and avoid remote locations.
- There are high homicide numbers in the non-tourist areas of Tijuana.
- Most homicides appear to be targeted. However, assassinations and territorial disputes between criminal organizations can injure or kill bystanders.
- U.S. citizens and lawful permanent residents have been victims of kidnapping.
- The only travel restrictions in Baja California state are in Mexicali Valley. There are no additional travel restrictions for U.S. government employees in Baja California state, including in Tijuana, Ensenada, and Rosarito.
- Review a map of restricted areas.
Mexicali Valley:
Due to security risks, U.S. government employees must follow these restrictions regarding Mexicali Valley.
U.S. government employees may not travel in the Mexicali Valley within the below boundaries:
- Eastern boundary: From the U.S. border to the Gulf of California along the U.S. and Baja or Sonora state borders.
- Southern boundary: A straight line east from La Ventana to the Gulf of California.
- Western boundary: The area east of Highway 5 from La Ventana to Boulevard Lazaro Cardenes in Mexicali City.
- Northern boundary: Boulevard Lazaro Cardenas or Highway 92 and U.S. Border from Highway 1 to the Sonora State border.
U.S. government employees may travel in the Mexicali Valley to the following areas:
- Mexicali City: Travel within Mexicali City north of Boulevard Lazaro Cardenes and Highway 92 and west of Highway 1 to the U.S. border.
- Los Algodones: Travel to and within the city limit is only permitted via the United States through the Andrade Port of Entry.
- Mexicali airport: Travel to and from Mexicali and the airport is permitted on Highway 1 and Highway 8 during daylight hours only.
State of Chiapas: Reconsider travel due to terrorism and crime.
- There is a risk of violence in the state from terrorist groups, cartels, gangs and criminal organizations.
- U.S. government employees may travel to Tapachula within the city limits and to the south and west of Highway 200.
- U.S. government employees may not travel to the municipality of Ocozocoautla.
- U.S. government employees may not travel to the following areas in Southeastern Chiapas within the below boundaries:
- East-Northeast boundary: The Mexico-Guatemala border from the Pacific Ocean to Netzahualcóyotl.
- Northern boundary: From Netzahualcóyotl in a straight line to Ocosingo.
- Western boundary: In straight lines from Ocosingo to El Ocote, from El Ocote to San Francisco Pujiltic, and from San Franciso Pujiltic to Mapastepec. Also, a straight line from southeast Tapachula to Tres Hermanos San Isidro on the coast.
- South-Southwest boundary: East and north of Highway 200 from Mapastepec to Tapachula.
- Review a map of restricted areas.
State of Chihuahua: Reconsider travel due to terrorism, crime, and kidnapping.
- There is a risk of violence in the state from terrorist groups, cartels, gangs and criminal organizations.
- Most homicides are targeted assassinations against members of criminal organizations.
- Territory battles between these groups have led to violent crime in places like restaurants and malls where U.S. citizens and government employees go. Shootings have hurt or killed bystanders.
- U.S. citizens and lawful permanent residents have been kidnapped.
- U.S. government employees may not travel to certain areas of Chihuahua, including Copper Canyon.
- Review a map of restricted areas.
Ascension:
- U.S. government employees may travel on Highway 2 directly between Ciudad Juarez and Ascension.
Ciudad Juarez:
- Due to security risks, U.S. government employees may travel to Ciudad Juarez within the below boundaries:
- Eastern boundary: Bulevar Independencia
- Southern boundary: De los Montes Urales; Avenida Manuel J Clouthier; Carretera de Juárez
- Western boundary: Via Juan Gabriel; Avenida de los Insurgentes; Calle Miguel Ahumada; Francisco Javier Mina; Melchor Ocampo
- Northern boundary: The U.S.-Mexico border
- U.S. government employees may travel directly to Ciudad Juarez’s Abraham González International Airport using the approved Highway 45 route and the factories located along Bulevar Independencia and Las Torres.
- U.S. government employees may travel to San Jerónimo only through the United States via the Santa Teresa U.S. Port of Entry; travel via Anapra is prohibited.
City of Chihuahua:
- U.S. government employees may travel to the city of Chihuahua within the below boundaries:
- Northern boundary: Avenida Transformación
- Eastern boundary: Avenida Tecnológico/Manuel Gómez Morín
- Western boundary: The city boundary
- Southern boundary: Highway 16 Calle Tamborel
- U.S. government employees may travel to Abraham Gonzalez International Airport and the factories (maquilas) outside this area by the most direct route.
- U.S. government employees may travel from Ciudad Juarez to Chihuahua City via Highway 45 with stops permitted only at the Military and Immigration Control Stations (KM 341), the Overlook (KM 342), Military Control Station (KM 315), the shops and restaurants on Highway 45 in the town of Villa Ahumada (KM 240-245), and the Military or Police Control Station (KM 32).
- U.S. government employees may travel south of the city of Chihuahua on Highway 45 to the southern boundary of Parral, including each town directly connected to Highway 45, including Lázaro Cárdenas, Pedro Meoqui, Santa Cruz de Rosales, Delicias, Camargo, Ciudad Jiménez, and Parral itself.
Northwest Chihuahua:
- U.S. Government employees may travel to the towns of Galeana, Colonia Le Baron, and San Buenaventura via Highway 10.
Nuevo Casas Grandes Area:
- U.S. government employees may travel to the Nuevo Casas Grandes area (Nuevo Casas Grandes, Casas Grandes, Mata Ortiz, Colonia Juárez, Colonia LeBaron, Paquimé and San Buenaventura) during daylight hours via Mexico Federal Highway 2, and then Federal Highway 10, or via the Palomas Port of Entry on U.S. Highway 11, continuing south until reaching Mexico Highway 2, turning west, and following Highway 10 to Nuevo Casas Grandes.
- U.S. government employees may stay overnight in the cities of Nuevo Casas Grandes and Casas Grandes only.
Ojinaga:
- U.S. government employees may travel to Ojinaga using Mexican highways and are required to enter through the U.S. Port of Entry in Presidio, Texas.
- Overnight travel in Ojinaga is permitted.
Palomas:
- U.S. government employees may travel to Palomas via U.S. highways through the U.S. Port of Entry in Columbus, New Mexico, or via Highway 2 and Avenida 5 de Mayo in Mexico.
- Overnight travel to Puerto Palomas is prohibited.
State of Coachuila: Reconsider travel due to terrorism and crime.
- There is a risk of violence in the state from terrorist groups, cartels, gangs and criminal organizations. U.S. government employees may not travel to the following area:
- Northern Coahuila: Travel north of Highway 53 and Highway 23, from Boquillas del Carmen to the Coahuila border. The eastern and western boundaries follow the Coahuila state borders north to the U.S. border.
- U.S. government employees may travel to the following areas:
- Piedras Negras via the U.S. only through the Eagle Pass Port of Entry.
- Nava and Allende via Highway 57 from Piedras Negras only.
- Acuna via the U.S. only through the Del Rio Port of Entry.
- Review a map of restricted areas.
State of Guanajuato: Reconsider travel due to terrorism and crime.
- There is a risk of violence in the state from terrorist groups, cartels, gangs and criminal organizations. Gang violence in Guanajuato mostly happens in the southern and central areas. It is often connected to the theft of oil and natural gas from the state oil company and other suppliers.
- There is a high number of murders in the southern region due to cartel-related violence.
- U.S. citizens and lawful permanent residents have been victims of kidnapping.
- U.S. government employees may not travel on Federal Highway 45D nor to the areas south of Highway 45D, including the cities of Celaya, Salamanca, and Irapuato.
- Review a map of restricted areas.
State of Jalisco: Reconsider travel due to terrorism, crime, and kidnapping.
- There is a risk of violence in the state from terrorist groups, cartels, gangs and criminal organizations.
- In Guadalajara, battles between criminal groups have happened in tourist areas.
- Shootings between these groups have injured or killed innocent bystanders.
- U.S. citizens and lawful permanent residents have been kidnapped.
- There are no restrictions on travel in the Guadalajara Metropolitan area, Puerto Vallarta (including neighboring Riviera Nayarit), Chapala, and Ajijic.
- U.S. government employees may not travel to the following areas:
- Southern Jalisco: May not travel on Federal Highway 110 from the state of Colima to the state of Michoacan, nor to the area to the south and east of Highway 110 to the Michoacan border, with an exception for Mazamitla.
- Federal Highway 80: May not travel on Federal Highway 80 between Cocula and Lazaro Cardenas (48989 – in the south).
- U.S. government employees may travel to the following area in southeastern Jalisco:
- Mazamitla: Travel via Highway 405 only.
- Review a map of restricted areas.
State of Morelos: Reconsider travel due to terrorism, crime, and kidnapping.
- There is a risk of violence in the state from terrorist groups, cartels, gangs and criminal organizations.
- U.S. citizens and lawful permanent residents have been victims of kidnapping.
- There are no specific restrictions on travel for U.S. government employees in Morelos state.
- Review a map of restricted areas.
State of Sonora: Reconsider travel due to terrorism, crime, and kidnapping.
- There is a risk of violence in the state from terrorist groups, cartels, gangs and criminal organizations.
- U.S. citizens and lawful permanent residents have been victims of kidnapping.
- Travelers should stay alert and aware of their surroundings while traveling in Sonora. Criminal activity and violence may occur in any area of Sonora.
- U.S. government employees may travel to: Hermosillo, Bahia de Kino, San Carlos-Nuevo Guaymas, Alamos, and Puerto Libertad.
- U.S. government employees must follow the below travel restrictions for Nogales, Puerto Penasco, Cananea, Agua Prieta, and eastern and southern Sonora.
- Review a map of restricted areas.
Nogales
- U.S. government employees may not use any taxi services, public buses, or ride-share applications in Nogales.
- U.S. government employees may travel to the following areas in the municipality of Nogales:
- Highway 15 corridor between the DeConcicini Port of Entry and the intersection of Highway 15 and Highway 15D. The Highway 15 corridor includes:
- The area south of the Council of the Federal Judiciary building on Calle Ochoa, between Avenida Alvaro Obregon and Adolfo Ruiz Cortinez, and to the intersection of Highway 15 and Avenida Alvaro Obregon.
- The area south of the intersection of Highway 15 and Avenida Alvaro Obregon, including Adolfo Ruiz Cortinez, and to the Donaldo Colosio Plaza.
- The Boulevard Luis Donaldo Colosio corridor between the Mariposa Port of Entry and the intersection with Highway 15. The Boulevard Luis Donaldo Colosio corridor includes:
- The industrial area east of Boulevard Luis Donaldo Colosio and between Avenida 5 de Febrero and F. Bustamante.
- Boulevard El Greco and the area northwest to Avenida Tecnologico.
- The area southeast of Avenida Tecnologico, between Highway 15 and Boulevard Luis Donaldo Colosio, and south to the intersection of Highway 15 and Boulevard Luis Donaldo Colosio.
- The Ignacio de La Torre Avenue de los Nogales Corridor between Boulevard El Greco and its intersection with Highway 15. The Ignacio de La Torre Avenida de los Nogales Corridor includes:
- The Guarnición de la Plaza Militar.
- The area between Highway 15 and Ignacio de La Torre Avenida de los Nogales.
Travel between Hermosillo and Nogales
- U.S. government employees may travel between Nogales and Hermosillo during daylight hours only and via Federal Highway 15 only.
- U.S. government employees may not use any taxi services, public buses, or ride-share applications.
- Travelers should be cautious and avoid unnecessary stops due to security incidents, including occasional armed carjackings.
- Shootings have occurred along this route during the day.
Puerto Peñasco
- U.S. government employees may travel between Puerto Peñasco and the Lukeville-Sonoyta U.S. Port of Entry via Federal Highway 8 only.
- U.S. government employees may not travel on any other route to Puerto Peñasco.
- U.S. government employees may not use any taxi services, public buses, or ride-share applications in Puerto Peñasco.
Cananea and Agua Prieta
- U.S. government employees may travel directly from the U.S. Port of Entry Douglas to Agua Prieta, but may not go beyond the city limits.
- U.S. government employees may travel directly from U.S. Port of Entry Douglas to Cananea on Highway 2 only. They cannot go beyond the city limits.
- Travel is limited to daylight hours only, with no overnight stays.
- Travel between Nogales and Cananea through Imuris on Highway 2 is not allowed.
- U.S. government employees may not use any taxi services, public buses, or ride-share applications in these cities.
Eastern and southern Sonora (including San Carlos-Nuevo Guaymas and Alamos)
- U.S. government employees may travel from Hermosillo to San Carlos-Nuevo Guaymas using Highway 15 and Highway 124. Traveling away from that route in the direction of Guaymas is prohibited.
- U.S. government employees may travel to Alamos by air.
- U.S. government employees may not travel to areas of Sonora east of Federal Highway 17 between Moctezuma and Santa Rosa.
- U.S. government employees cannot travel to Guaymas and areas south of Guaymas.
Level: 2 – Exercise increased caution
State of Agurascalientes: Exercise increased caution due to terrorism and crime.
- There is a risk of violence in the state from terrorist groups, cartels, gangs and criminal organizations.
- There are no specific restrictions on travel for U.S. government employees in Aguascalientes state.
- Review a map of restricted areas.
State of Baja Sur: Exercise increased caution due to terrorism and crime.
- There is a risk of violence in the state from terrorist groups, cartels, gangs and criminal organizations.
- There are no specific restrictions on travel for U.S. government employees in Baja California Sur state.
- Review a map of restricted areas.
State of Durango: Exercise increased caution due to terrorism and crime.
- There is a risk of violence inthe state from terrorist groups, cartels, gangs and criminal organizations.
- U.S. government employees may not travel west or south of Federal Highway 45.
- Review a map of restricted areas.
State of Hidalgo: Exercise increased caution due to terrorism and crime.
- There is a risk of violence in the state from terrorist groups, cartels, gangs and criminal organizations.
- There are no specific restrictions on travel for U.S. government employees in Hildago state.
- Review a map of restricted areas.
Mexico City (Cuidad de Mexico): Exercise increased caution due to terrorism and crime.
- There is a risk of violence in the state from terrorist groups, cartels, gangs and criminal organizations.
- Both violent and non-violent crimes occur throughout Mexico City.
- Exercise extra caution, especially at night, outside of popular tourist areas where police patrol more frequently.
- Petty crime occurs frequently in both tourist and non-tourist areas.
- There are no specific restrictions on travel for U.S. government employees in Mexico City.
- Review a map of restricted areas.
State of Mexico (Estadio De Mexico):Exercise increased caution due to terrorism, crime, and kidnapping.
- There is a risk of violence in the state from terrorist groups, cartels, gangs and criminal organizations.
- U.S. citizens and lawful permanent residents have been victims of kidnapping.
- Use additional caution in remote areas.
- There are no specific restrictions on travel for U.S. government employees in Mexico State.
- Review a map of restricted areas.
State of Nayarit: Exercise increased caution due to terrorism and crime.
- There is a risk of violence in the state from terrorist groups, cartels, gangs and criminal organizations.
- There are no specific restrictions on travel for U.S government employees in Nayarit state.
- Review a map of restricted areas.
State of Nuevo Leon: Exercise increased caution due to terrorism and crime.
- There is a risk of violence in the state from terrorist groups, cartels, gangs and criminal organizations.
- There are no specific restrictions on travel for U.S. government employees in Nuevo Leon state.
- Review a map of restricted areas.
State of Oaxaco: exercise increased caution due to terrorism and crime.
- There is a risk of violence in the state from terrorist groups, cartels, gangs and criminal organizations.
- There are no restrictions on travel for Oaxaca City, Monte Alban, Puerto Escondido, or Huatulco.
- U.S. government may not use Federal Highway 200 between Pinotepa and the Oaxaca-Guerrero border.
- U.S. government employees may not travel to the Isthmus region within the below boundaries:
- Western boundary: Federal Highway 185D.
- Northern boundary: Federal highway 190.
- Eastern boundary: Oaxaca-Chiapas border.This includes the towns of Juchitan de Zaragoza, Salina Cruz, and San Blas Atempa.
- Review a map of restricted areas.
State of Puebla: Exercise increased caution due to terrorism, crime, and kidnapping.
- Cartels that are designated as terrorist organizations are present in this state.
- Criminal activity and violence occur throughout the state.
- U.S. citizens and lawful permanent residents have been victims of kidnapping.
- There are no specific restrictions on travel for U.S. government employees in Puebla state.
- Review a map of restricted areas.
State of Queretaro: Exercise increased caution due to terrorism and crime.
- There is a risk of violence in the state from terrorist groups, cartels, gangs and criminal organizations.
- There are no specific restrictions on travel for U.S. government employees in Queretaro state.
- Review a map of restricted areas.
State of Quintana Roo: Exercise increased caution due to terrorism and crime.
- There is a risk of violence in the state from terrorist groups, cartels, gangs and criminal organizations.
- Shootings between rival gangs have injured and killed innocent bystanders.
- U.S. citizens have been the victims of both non-violent and violent crimes in tourist and non-tourist area
- Pay attention to your surroundings after dark in downtown areas of Cancun, Tulum, and Playa del Carmen.
- Remain in well-lit pedestrian streets and tourist zones.
- Review a map of restricted areas.
State of San Luis Potosi: Exercise increased caution due to terrorism, crime, and kidnapping.
- There is a risk of violence in the state from terrorist groups, cartels, gangs and criminal organizations.
- U.S. citizens and lawful permanent residents have been victims of kidnapping.
- There are no specific restrictions on travel for U.S. government employees in San Luis Potosi state.
- Review a map of restricted areas.
State of Tabasco: Exercise increased caution due to terrorism and crime.
- There is a risk of violence in the state from terrorist groups, cartels, gangs and criminal organizations.
- There are no specific restrictions on travel for U.S. government employees in Tabasco state.
- Review a map of restricted areas.
State of Tlaxcala: Exercise increased caution due to terrorism and crime.
- There is a risk of violence in the state from terrorist groups, cartels, gangs and criminal organizations.
- Review a map of restricted areas.
State of Vera Cruz: Exercise increased caution due to terrorism and crime.
- There is a risk of violence in the state from terrorist groups, cartels, gangs and criminal organizations.
- While most gang-related violence is targeted, bystanders can become victims.
- There are no specific restrictions on travel for U.S. government employees in Veracruz state.
- Review a map of restricted areas.
Level: 1 – Exercise normal precautions
State of Compeche: Exercise normal precautions.
- However, be aware that cartels designated as terrorist organizations are present in this state.
- There are no specific restrictions on travel for U.S. government employees in Campeche state.
- Review a map of restricted areas.
State of Yucatan: Exercise normal precautions.
- There is a risk of violence in the state from terrorist groups, cartels, gangs and criminal organizations.
- There are no specific travel restrictions on travel for U.S. government employees in Yucatan state.
- Review a map of restricted areas.
If you decide to travel to Mexico:
Date Issued: Fri, 29 Nov 2024
Reissued after periodic review with minor edits.
Exercise increased caution while traveling to Moldova. This is due to unresolved conflict between the breakaway region of Transnistria and the central government. Read the entire Travel Advisory.
Country Summary: There have been reports of debris from airborne projectiles landing in Moldova, however there is no indication that Moldova is being targeted in Russia’s war against Ukraine. The Chisinau airport is operating normally although there are no flights available to or from Belarus, Russia or Ukraine.
Read the Moldova country information page for additional information on travel.
If you decide to travel to Moldova:
Transnistria – Level 3: Reconsider Travel
Transnistria. There is also military conflict in nearby Ukraine.
Transnistria is a region that is not under the control of the Moldovan government. Visitors must show identification to cross into Transnistria. Those without a Moldovan government-issued identification document will have to show a passport. Visitors may also have to show ID such as a passport at checkpoints. This is at roads leading into and out of the region. Ukraine has closed its border crossing points into the Transnistrian region. Taking photographs of military facilities and security forces is not allowed and may result in trouble with authorities.
The U.S. government’s ability to provide emergency services to U.S. citizens traveling in Transnistria maybe be limited or delayed since Transnistria’s de facto authorities control access to the region.
Visit our website for Travel to High-Risk Areas.
Date Issued: Wed, 22 Jan 2025
Reissued after periodic review without changes.
Exercise normal precautions in Mongolia.
Read the country information page for additional information on travel to Mongolia.
If you travel to Mongolia, you should:
Date Issued: Tue, 26 Nov 2024
Reissued after periodic review without changes.
Exercise normal precautions in Montenegro.
Read the country information page for additional information on travel to Montenegro.
If you decide to travel to Montenegro:
Date Issued: Thu, 22 Aug 2024
Reissued after periodic review with minor edits.
Exercise normal precautions in Montserrat.
Read the country information page for additional information on travel to Montserrat.
If you decide to travel to Montserrat:
Date Issued: Mon, 21 Apr 2025
Reissued after periodic review with minor edits.
Exercise increased caution in Morocco due to terrorism.
Country Summary: Terrorist groups continue plotting possible attacks in Morocco. Terrorists may attack with little or no warning. They target tourist locations, transportation hubs, markets, shopping malls, and local government facilities.
Read the country information page for additional information on travel to Morocco.
If you decide to travel to Morocco:
Date Issued: Mon, 16 Jun 2025
Updated to reflect change in overall travel advisory level from 3 to 2 due to decrease of election related protests, and addition of Niassa Special Reserve to Do Not Travel section.
Exercise increased caution when traveling to Mozambique due to health issues, crime, civil unrest, and terrorism. Some areas have greater risk. Read the entire Travel Advisory.
Do Not Travel To:
- Cabo Delgado Province, the Niassa Special Reserve inside Niassa Province, and certain districts in the north of Nampula Province due to terrorism.
Country Summary: Unplanned protests remain possible throughout the country and can quickly become violent. Protests may temporarily block major roads, including toll booths and border crossings.
Violent crime, such as mugging, is common.
Mozambique’s health infrastructure is weak, medicine availability is variable and often in short supply. Local medical facilities may lack basic resources and supplies, and may require cash payment up front. There is risk of terrorist violence, including terrorist attacks and other activity in Mozambique. Visit the U.S. Department of State’s country reports on terrorism to learn more.
Terrorist groups in northern Mozambique continue to be active. Attackers may strike public areas and tourist destinations with little or no warning, sometimes taking hostages. Upscale lodges in remote areas which cater to international big-game hunters have been targeted. Security and police forces may be slow to respond.
Read the country information page for additional information on travel to Mozambique.
If you decide to travel to Mozambique:
- Avoid all but emergency travel between sunset and sunrise.
- Avoid demonstrations and crowds.
- Enroll in the Smart Traveler Enrollment Program (STEP) to receive messages and Alerts from the U.S. Embassy and make it easier to locate you in an emergency.
- Review the Country Security Report for Mozambique.
- Prepare a plan for emergency situations. Review the Traveler’s Checklist.
- Visit the CDC page for the latest Travel Health Information related to your travel and return to the United States.
- We highly recommend you buy insurance before you travel. Check with your travel insurance provider about evacuation assistance, medical insurance, and trip cancellation coverage.
- Have evacuation plans that do not rely on U.S. government assistance.
- Have travel documents up to date and easily accessible.
- Keep a low profile.
- Be aware of your surroundings.
- Monitor local media for breaking events and be prepared to adjust your plans.
Cabo Delgado Province, the Niassa Special Reserve within Niassa Province, and certain northern districts in Nampula Province – Level 4: Do Not Travel
Terrorists continue to conduct and plot attacks on government forces, villages, and key supply routes in Cabo Delgado Province and the bordering districts of Memba and Erati in Nampula Province. Cabo Delgado’s capitol city of Pemba is vulnerable to attack due to the proximity of violent extremist forces and their increasing sophistication. Upscale hunting lodges in and around the Niassa Special Reserve have been specifically targeted by terrorists with hostages taken.
Although prior terrorist attacks centered around securing resources from government forces, travelers should be aware of their surroundings, especially in large public places.
Be aware of increased government security checkpoints in Cabo Delgado Province.
If you must travel to the affected areas of Cabo Delgado, Niassa, and Nampula Provinces, consider hiring a security firm.
Visit our website for Travel to High-Risk Areas.
Date Issued: Mon, 23 Dec 2024
Updated to include a risk indicator for health and updates to crime.
Exercise increased caution in Namibia due to crime and health risks.
Country Summary: Potentially violent crimes, such as home invasions, break-ins, muggings, and “smash and grabs” from vehicles stopped at intersections, parked near common tourist areas, or located in shopping mall parking lots are increasingly common. Crimes of opportunity, primarily the theft of money, cell phones, and personal property, are common.
Namibia is sparsely-populated and many visitors travel to remote areas far from emergency services and medical facilities. Health facilities are limited and may not have adequate supplies of basic medications, especially outside of large cities.
Read the Country Information Page for additional information on travel to Namibia.
If you decide to travel to Namibia:
- Avoid walking alone, especially after dark.
- Do not display large amounts of cash or other valuables.
- Keep car doors locked and windows shut at all times.
- Be cautious of people appearing to request assistance by the side of the road.
- Use ATMs located in well-lit public places or inside a bank or other business and be cautious of anyone offering assistance in using the ATM.
- Always carry a copy of your U.S. passport and Namibian visa or entry stamp (if applicable). Keep original documents in a secure location.
- While travel medical insurance is recommended for all travelers, local medical facilities are likely to require full payment in cash at the time of service and may otherwise deny care.
- Travelers to Namibia should have medical evacuation insurance.
- Enroll in the Smart Traveler Enrollment Program (STEP) to receive Alerts and make it easier to locate you in an emergency.
- Follow the Department of State on Facebook and X/Twitter.
- Review the Country Security Report for Namibia.
- Prepare a contingency plan for emergency situations. Review the Traveler’s Checklist
- Visit the CDC page for the latest Travel Health Information related to your travel.
Date Issued: Mon, 02 Dec 2024
Reissued after periodic review without changes.
Exercise normal precautions in Nauru.
Read the country information page for additional information on travel to Nauru
If you decide to travel to Nauru:
Date Issued: Thu, 11 Sep 2025
Reconsider travel to Nepal due to civil unrest.
Advisory summary
Large protests and significant demonstrations in Nepal on September 8-9, 2025, turned violent.
- These events caused deaths and injuries. Local authorities have declared curfews in major cities like Kathmandu and Pokhara.
- Additional protests and curfews could happen with little warning.
- Follow local authorities’ instructions. Stay away from areas with protests, unrest, or large gatherings.
Emergency services
Emergency services in Nepal have limited ability to respond to personal emergencies. Their response may be delayed. Some hotels in Kathmandu and Pokhara were set on fire during the unrest.
- Check with your hotel, airline, or tour operator for the latest updates before traveling.
- Make sure to confirm your travel plans with your airline before departing for the airport.
U.S. citizens with emergencies:
The U.S. government has limited ability to provide emergency services to U.S. citizens in Nepal.
- If you decide to travel to Nepal: Have a plan to leave in an emergency that does not depend on U.S. government help. Review our information on Crisis and Evacuations.
- Check local media for breaking news. Be prepared to adjust your plans.
- Prepare to evacuate hotels at a moment’s notice.
- Follow the instructions of local authorities.
- Avoid demonstrations and crowds.
- Enroll in the Smart Traveler Enrollment Program (STEP) to get important updates and alerts from the U.S. embassy or consulate. Enrolling helps the U.S. embassy or consulate contact you or your emergency contact in an emergency.
- Review the Country Security Report for Nepal.
- Whether you’re a first time or frequent traveler, use the International Travel Checklist.
- We highly recommend that you buy travel insurance before you travel. Check with your travel insurance provider about evacuation assistance, medical insurance, and trip cancelation coverage.
- Review our information on Travel to High-Risk Areas.
Date Issued: Fri, 09 Aug 2024
Reissued after periodic review without changes.
Exercise increased caution in the Netherlands due to terrorism.
Country Summary: Terrorists continue plotting possible attacks in the Netherlands. Terrorists may attack with little or no warning, targeting tourist locations, transportation hubs, markets/shopping malls, local government facilities, hotels, clubs, restaurants, places of worship, parks, major sporting and cultural events, educational institutions, airports, and other public areas.
Read the country information page for additional information on travel to the Netherlands.
If you decide to travel to the Netherlands:
- Be aware of your surroundings.
- Stay alert in locations frequented by large crowds.
- Follow the instructions of local authorities including movement restrictions related to any ongoing police action.
- Monitor local media for breaking events and adjust your plans.
- Enroll in the Smart Traveler Enrollment Program (STEP) to receive Alerts and make it easier to locate you in an emergency.
- Follow the Department of State on Facebook and X/Twitter.
- Review the Country Security Report for the Netherlands.
- Visit the CDC page for the latest Travel Health Information related to your travel.
- Prepare a contingency plan for emergency situations. Review the Traveler’s Checklist.
Date Issued: Tue, 04 Jun 2024
Updated to reflect change to Travel Advisory Level 3.
Reconsider travel to New Caledonia due to civil unrest and crime.
U.S. citizens should reconsider travel to New Caledonia or consider departing by commercial or other privately available transportation options, in light of the current security situation and infrastructure challenges following riots related to electoral reform in May 2024. The French Government has taken and/or could take additional measures, including declaring a state of emergency, curfews, restrictions on freedom of movement, ID verification, and increased security inspections. Follow any state of emergency measures imposed in your province.
Protests, demonstrations, tire burning, and roadblocks are frequent, unpredictable, and have turned violent. During civil unrest, commercial transportation may become unavailable without warning for U.S. citizens wishing to depart New Caledonia. The U.S. government is extremely limited in its ability to provide emergency services to U.S. citizens in New Caledonia – assistance on site is available only from local authorities.
Read the country information page for additional information on travel to New Caledonia.
If you decide to travel to New Caledonia:
- Avoid demonstrations and crowds.
- Do not attempt to drive through roadblocks.
- Monitor local media for breaking events and be prepared to adjust your plans.
- Be aware of your surroundings.
- Formulate departure plans that do not rely on U.S. government assistance.
- Enroll in the Smart Traveler Enrollment Program (STEP) to receive Alerts and make it easier to locate you in an emergency.
- Follow the Department of State on Facebook and Twitter/X.
- Review the Country Security Report for New Caledonia.
- Visit the CDC page for the latest Travel Health Information related to your travel.
- Prepare a contingency plan for emergency situations. Review the Traveler’s Checklist.
Date Issued: Fri, 03 Jan 2025
Reissued after periodic review with minor edits.
Exercise normal precautions in New Zealand.
Read the country information page for additional information on travel to New Zealand.
If you decide to travel to New Zealand:
Date Issued: Fri, 13 Dec 2024
Reissued with updates to information on arbitrary enforcement of laws.
Reconsider travel to Nicaragua due to arbitrary enforcement of laws, the risk of wrongful detention, and limited healthcare availability. Exercise increased caution in Nicaragua due to crime.
Country Summary: The Government of Nicaragua targets individuals and organizations for political purposes. These include:
- NGO workers,
- Academics and students,
- Business representatives,
- Civil society leaders,
- Religious and charity workers (including foreign missionaries),
- Journalists,
- And many others.
In the past year, the Government of Nicaragua has subjected U.S. citizens to arbitrary entry and exit bans, expulsions, arrests, revocations of Nicaraguan citizenship, and other actions.
The Government of Nicaragua may:
- Arbitrarily deny entry or re-entry to Nicaragua or departure from Nicaragua to U.S. citizens and Nicaraguan citizens. This includes entry by air or land. Travel refunds are NOT provided in these cases. Denials and exit bans can occur for political reasons. This includes perceived support for or association with those the government disfavors. The government is not required to provide a basis for its denial.
- Search personal phones, computers, social media accounts, and documents for anti-government content.
- Limit photography.
- Seize personal devices.
- Target individuals for political reasons, regardless of nationality. These can include former allies, political activists, business representatives, religious and charity groups, clergy, missionaries, human rights advocates, civil society leaders, academics, and journalists.
- Target pro-democracy advocates and their family members.
- Confiscate privately-owned land, residences, financial assets, or personal property. They may do this without warning or due process.
- Arbitrarily detain, accuse, and charge individuals with terrorism, money laundering, or organized crime offenses. They may do this without fair or transparent processes.
The Department has determined there is a risk of wrongful detention of U.S. nationals by the Government of Nicaragua. U.S. citizens should reconsider travel to Nicaragua, including to work for or volunteer with non-profits or religious organizations. Since 2018, the Government of Nicaragua has closed more than 5,300 civil society organizations, including religious organizations. Nicaraguan security services have arrested U.S. citizens on false charges. This includes dual U.S.-Nicaraguan citizens. Those arrested can be denied fair and transparent treatment. Convictions routinely occur in non-public trials without adequate defense or credible evidence. Nicaraguan authorities also arbitrarily enforce laws against U.S. citizen religious workers. Nicaraguan authorities have conducted questionable criminal investigations against U.S. citizens engaged in religious activity. U.S. citizens arrested in Nicaragua may be detained for long periods without charges. Judicial processes often lack transparency. This is especially true in politically motivated arrests and property disputes. Political objectives and pressure may affect the willingness of a local attorney to assist and impact the outcomes of legal processes. Prison conditions can be harsh and life-threatening.
Managua has a sole private hospital that is JCAHO (Joint Commission on Accreditation of Healthcare Organizations) accredited and certified, with labs and radiology services available, though it has a very limited number of specialists for acute emergencies. Medical services outside Managua are limited, including for victims of crime. Government hospitals are understaffed and some hospitals throughout the country may not be able to assist in emergencies. Tap water is not reliably potable. Drink only purified bottled water.
Travelers should exercise increased caution and remain alert to the risks of crime. These include violent crimes such as sexual assault and armed robbery.
Poor infrastructure can limit the Embassy’s emergency assistance to U.S. citizens. Travel by U.S. government personnel may be restricted at any time.
Read the country information page for additional information on travel to Nicaragua.
If you decide to travel to Nicaragua:
- Consider arrangements to depart the country quickly.
- Ensure your U.S. passport is valid for your entire stay.
- Avoid demonstrations and restrict unnecessary travel.
- Do not attempt to drive through crowds, barricades, or roadblocks.
- Maintain adequate supplies of food, cash, potable water, and fuel in case you need to shelter in place.
- Use caution when walking or driving at night.
- Keep a low profile.
- Do not display signs of wealth such as expensive watches or jewelry.
- Remain aware of your surroundings.
- Develop a communication plan with family and/or your employer or host organization.
- Be prepared for the high risk of indefinite arbitrary detention on false charges without consular access.
- Visit our website for Travel to High-Risk Areas.
- Enroll in the Smart Traveler Enrollment Program (STEP) to receive Alerts and make it easier to locate you in an emergency.
- Follow the Department of State on Facebook and X (formerly known as “Twitter”).
- Review the Country Security Report for Nicaragua.
- Prepare a contingency plan for emergency situations. Review the Traveler’s Checklist.
- Visit the CDC page for the latest Travel Health Information related to your travel.
Date Issued: Thu, 29 Jan 2026
Do not travel to Niger for any reason due to crime, unrest, terrorism, health, and kidnapping.
On January 30, 2026, the Department of State ordered non-emergency government employees and their family members to leave Niger due to safety risks.
The U.S. government cannot offer routine or emergency services to U.S. citizens outside of Niamey due to safety risks.
A state of emergency and movement restrictions are in place in many regions throughout Niger.
- Nigerien authorities require military escorts for any foreigners traveling outside Niamey, including U.S. government personnel.
- Areas under a state of emergency are off-limits and subject to change.
U.S. government employee travel restrictions
U.S. government employees working in Niger must:
- Travel in armored vehicles for all movements, and
- Observe a mandatory curfew.
All restaurants and open-air markets are off-limits to U.S. government employees working in Niger.
U.S. citizens in Niger are advised to take the same precautions.
Terrorism
There is risk of terrorist violence, including terrorist attacks and other activity in Niger. Visit the U.S. Department of State’s Country Reports on Terrorism to learn more.
Terrorists continue to plot attacks and use kidnapping for ransom as a business model. They target vulnerable groups and U.S. interests.
Terrorists and their supporters are active in planning kidnappings in Niger and they may attack anywhere. Recent attacks and kidnappings have occurred in:
- Niamey
- The Malian border area (Tillabéri Region, Tri-Border Zone)
- The Diffa Region (Lake Chad Basin)
- Northern Agadez
- The southern border corridor along the Niger-Benin oil pipeline
Kidnapping
Terrorist groups continue planning kidnappings of foreigners in Niger.
Crime
Violent crimes can happen at any time. Crimes include armed robbery and residential break-ins.
Unrest
Demonstrations may take place in response to political or economic issues. They may also occur on holidays and during large events.
- Demonstrations can be unpredictable.
- The Nigerien government limits or does not authorize large gatherings. It increases security presence around planned protests. This includes stationary checkpoints and roadblocks.
Health
Medical services in Niger are limited. Adequate trauma and ambulance services are not widely available. There is limited access to medicines including antibiotics. Even a minor health issue may require medical evacuation at your expense.
- Find out if your health insurance plan covers any medical expenses abroad. Most U.S. plans do not.
- If you purchase medical travel insurance, you are responsible for seeking reimbursement from your medical insurance. Follow their guidance and instructions for filing claims.
- We strongly recommend supplemental insurance to cover medical evacuation.
Date Issued: Tue, 15 Jul 2025
Updated to reflect inconsistent availability of health care services.
Reconsider travel to Nigeria due to crime, terrorism, civil unrest, kidnapping, armed gangs, and inconsistent availability of health care services. Some places in Nigeria have an increased risk. Overall, all locations carry significant security risks. Read the entire Travel Advisory.
Do Not Travel to:
- Borno, Yobe, Kogi, and northern Adamawa states due to terrorism and kidnapping
- Bauchi, Gombe, Kaduna, Kano, Katsina, Sokoto, and Zamfara states due to kidnapping
- Abia, Anambra, Bayelsa, Delta, Enugu, Imo, and Rivers states (with the exception of Port Harcourt) due to crime, kidnapping, and armed gangs.
Country Summary:
Violent crime is common in the country. This includes armed robbery, assault, carjacking, kidnapping, hostage-taking, roadside banditry, and rape. Kidnappings for ransom happen often. They primarily target dual national citizens visiting Nigeria and U.S. citizens perceived as wealthy. Kidnapping gangs have also stopped victims on interstate roads.
Terrorism
There is risk of terrorist violence in Nigeria. This includes terrorist attacks and other activities.
Terrorists continue plotting and carrying out attacks in Nigeria. Terrorists collaborate with local gangs to expand their reach. They may attack with little or no warning, including:
- Shopping centers and malls
- Markets
- Hotels
- Places of worship
- Restaurants and bars
- Schools
- Government buildings
- Transportation hubs
- Public places where crowds gather
Visit the U.S. Department of State’s country reports on terrorism to learn more.
Gangs and crime
Civil unrest and armed gangs are active in parts of Southern Nigeria. This is especially true in the Niger Delta and Southeast regions. Armed crime and gangs are common in the area. Crimes include kidnapping and assaults on Nigerian security services.
Violence can flare up between communities of farmers and herders in rural areas.
Unreliable health care
U.S. citizens should not expect the same level of health care to be available in Nigeria as they do in the United States:
- Nigerian medical facilities are generally not equipped to U.S. or European standards.
- Many medicines are not available. This includes common medications for diabetes or asthma.
- Bring enough over-the-counter and prescription medicines to last your entire stay in Nigeria.
- Update vaccinations to include all standard vaccinations, plus yellow fever, meningitis, typhoid, cholera, hepatitis A, hepatitis B, and a polio booster.
- All visitors should take Malaria prophylaxis. Nigeria is high risk for Malaria.
- Counterfeit pharmaceuticals are a common problem.
- Hospitals often expect immediate cash payment for health services.
- Most hospitals and doctors do not accept U.S. health insurance.
- Emergency services like those in the United States or Europe do not exist.
- Blood supply is often unreliable.
- Ambulance services are unreliable, have poor equipment, and often do not have trained paramedics.
- We strongly recommend getting traveler’s insurance, including medical evacuation insurance, before traveling.
- The Department of State does not pay medical bills for U.S. citizens overseas.
- U.S. Medicare/Medicaid do not work overseas.
Due to security risks, U.S. government employees cannot provide emergency services to U.S. citizens in many areas of Nigeria.
Read the country information page for additional information on travel to Nigeria.
If you decide to travel to Nigeria:
- Carry proper identification, including a U.S. passport with a current Nigerian visa, if needed.
- Use caution when walking or driving.
- Keep a low profile.
- Review travel routes and times. Vary your predictability.
- Do not physically resist any robbery attempt.
- Be extra vigilant when visiting banks or ATMs.
- Check local media for breaking events and be prepared to adjust your plans.
- Be aware of your surroundings.
- Stay alert in locations frequented by foreign tourists.
- Avoid demonstrations and large political gatherings.
- Review your personal security plans.
- Have evacuation plans that do not depend on U.S. government help.
- Establish a “proof of life” protocol with your loved ones, so that if you are taken hostage, your loved ones know specific questions (and answers) to ask the hostage-takers to be sure that you are alive. This helps to rule out scams.
- Enroll in the Smart Traveler Enrollment Program (STEP) to receive alerts. It makes it easier to locate you in an emergency.
- Get comprehensive medical insurance that includes medical evacuation.
- Review the Country Security Report for Nigeria.
- Prepare a backup plan for emergency situations. Review the Traveler’s Checklist.
- Visit the CDC page for the latest Travel Health Information related to your travel.
Borno, Yobe, Kogi, and Northern Adamawa states – Level 4: Do Not Travel
Do not travel to these areas for any reason.
The security situation in these states is unstable and uncertain. This is because of widespread terrorist activity, violence between communities, and kidnapping. Security operations to counter these threats may occur without warning.
Terrorist groups in the Northeast often target:
- Humanitarian camps
- Security forces
- Churches and mosques
- Schools
- Government buildings
- Entertainment venues
- Road travelers
Violence in Northeast Nigeria has forced about two million Nigerians to leave their homes.
Visit our website for Travel to High-Risk Areas.
Bauchi, Gombe, Kaduna, Kano, Katsina, Sokoto and Zamfara states – Level 4: Do Not Travel
Do not travel to these areas for any reason.
The security situation in these states is unstable and uncertain due to civil unrest. Widespread violence between communities and armed crime, including kidnapping and roadside banditry. Security operations to counter these threats may occur without warning.
Visit our website for Travel to High-Risk Areas.
Abia, Anambra, Bayelsa, Delta, Enugu, Imo, and Rivers states (with the exception of Port Harcourt) – Level 4: Do Not Travel
Do not travel to these areas for any reason.
Crime is widespread in Southern Nigeria. There is a high risk of kidnapping, violent protests, and armed gangs.
Visit our website for Travel to High-Risk Areas.
Date Issued: Tue, 29 Apr 2025
Reissued after periodic review with minor edits.
Do not travel to North Korea due to the continuing serious risk of arrest, long-term detention, and the threat of wrongful detention of U.S. nationals. Do not travel to the Democratic People’s Republic of Korea for any reason.
- U.S. passports cannot be used to travel to, in, or through the Democratic People’s Republic of Korea (DPRK or North Korea) unless they are specially validated for such travel by the Secretary of State.
- Special validations are granted only in very limited circumstances. More information on how to apply for the special validation is available here.
Because the U.S. government does not have diplomatic relations with North Korea, it cannot provide direct help to U.S. citizens in North Korea in emergencies. Sweden serves as the U.S. protecting power in North Korea through its Embassy in Pyongyang and provides limited consular services to U.S. citizens. Additionally, the North Korean government has often delayed or denied Swedish officials access to U.S. citizens who are detained. The Federal Aviation Administration (FAA) has issued a Notice to Airmen (NOTAM) and/or a Special Federal Aviation Regulation (SFAR). This is due to the risks to civil aviation operating within or in the vicinity of North Korea. For more information U.S. citizens should consult the Federal Aviation Administration’s Prohibitions, Restrictions and Notices.
Read the country information page for additional information on travel to North Korea.
- If you receive a special validation to travel to North Korea: The Department has determined that the risk of wrongful detention of U.S. nationals exists.
- The Government of the North Korea has subjected U.S. citizens to arbitrary entry and exit bans, expulsions, arrests, and other actions. The U.S. government cannot guarantee your release.
- Visit our website for Travel to High-Risk Areas.
- Draft a will and designate appropriate insurance beneficiaries or power of attorney.
- Enroll in the Smart Traveler Enrollment Program (STEP) to receive messages and Alerts from the U.S. Embassy and make it easier to locate you in an emergency.
- Visit the CDC page for the latest Travel Health Information related to your travel and return to the United States.
- Prepare a plan for emergency situations. Review the Traveler’s Checklist.
- We highly recommend that you buy insurance before you travel. Check with your travel insurance provider about evacuation assistance, medical insurance, and trip cancellation coverage.
Date Issued: Tue, 14 Jan 2025
Read the country information page for additional information on travel to North Macedonia.
If you decide to travel to North Macedonia:
Date Issued: Mon, 03 Feb 2025
Reissued after periodic review with minor edits
Exercise normal precautions in Norway.
Read the country information page for additional information on travel to Norway.
If you decide to travel to Norway:
Date Issued: Mon, 04 Nov 2024
Updated to include additional information in country summary and other minor edits.
Exercise increased caution due to terrorism. Some areas have increased risk. Read the entire Travel Advisory.
Do not travel to:
- The Yemen border area due to terrorism and armed conflict.
Country Summary: Due to risks to civil aviation operating within the Persian Gulf and the Gulf of Oman region, including Oman, the Federal Aviation Administration (FAA) has issued an advisory Notice to Air Missions (NOTAM) and/or a Special Federal Aviation Regulation (SFAR). For more information U.S. citizens should consult the Federal Aviation Administration’s Prohibitions, Restrictions and Notices.
Terrorism Summary: Residents and visitors generally find Oman to be safe, and protests have been rare, peaceful, and closely monitored by the government. However, threats – including terrorism – remain possible. Terrorists may attack with little or no warning, and targets may include tourist locations, transportation hubs, places of worship, markets, shopping malls, or any place where large crowds gather. The Embassy advises U.S. citizens to avoid protests and to always remain vigilant.
Read the country information page for additional information on travel to Oman.
If you decide to travel to Oman:
Yemen Border Area
Terrorist attacks and armed conflict continue in Yemen. Crossing the Oman-Yemen border can be dangerous. U.S. citizens who attempt to cross the border, from either Oman or Yemen, may be detained by Omani authorities.
Visit our website for High-Risk Travelers.
Date Issued: Mon, 26 Jan 2026
Reconsider travel to Pakistan due to terrorism and the potential for armed conflict. Some areas have increased risk. Read the entire Travel Advisory.
There is risk of terrorist attacks in Pakistan.
Terrorism
Violent extremist groups have carried out attacks in Pakistan. Terrorist attacks typically happen in Balochistan and Khyber Pakhtunkhwa, including the former FATA, but they have also occurred in major cities such as Karachi and Islamabad.
- Terrorists may strike without warning. They target transportation hubs, hotels, markets, malls, military and security forces sites, airports, trains, schools, hospitals, places of worship, tourist spots, and government buildings.
Demonstrations
Local law prohibits protesting or demonstrating without a permit.
- Being near a protest can draw scrutiny from Pakistani security forces.
- U.S. citizens have been detained for participating in protests. You can also face detention for posting content on social media viewed as critical of the Pakistani government, military, or officials.
- Internet and mobile phone service outages are common, especially during protests.
Crime
Pakistan’s security environment remains fluid. It sometimes changes without notice and can be a serious threat.
- There are greater security resources and infrastructure in the major cities. Security forces in these areas may be more readily able to respond to an emergency compared to other areas of the country.
- The most reported crimes are pickpocketing, bag-snatching, and phone theft.
Limited U.S. consular assistance
The Government of Pakistan restricts the travel of U.S. government personnel working in Pakistan.
- U.S. government employees working in Pakistan are required to use armed escorts and armored vehicles when traveling in certain parts of the country, both for official and personal travel.
- The U.S. government has a limited ability to assist or provide services to U.S. citizens in the KP Province, Balochistan Province, Pakistan-administered Azad Kashmir, and most areas outside of Islamabad, Lahore, and Karachi.
- U.S. government personnel working in Pakistan must obtain special authorization from the host government to travel to most areas outside of Islamabad, Lahore, and Karachi.
- Additional restrictions on movements can occur suddenly and at any time. This depends on local circumstances and security conditions.
- U.S. government employees working in Pakistan are generally prohibited from attending most large gatherings, such as political rallies or religious ceremonies.
Dual nationals
The U.S. embassy and consulates have a limited ability to provide consular services to dual U.S.-Pakistani citizens who have been arrested or detained. Pakistani law considers such individuals to be exclusively citizens of Pakistan.
Do Not Travel to:
- Balochistan Province and Khyber Pakhtunkhwa (KP) Province, including the former Federally Administered Tribal Areas (FATA), due to terrorism and kidnapping.
- The immediate vicinity of the Line of Control due to terrorism and the potential for armed conflict.
Date Issued: Wed, 07 Jan 2026
Exercise normal precaution in Palau. Some areas have increased risk.
Palau is generally a safe destination for travelers. U.S. citizens should always exercise caution when traveling abroad. Use the travel guidance here to stay safe.
Date Issued: Mon, 23 Sep 2024
Updated to reflect information on areas of civil unrest.
Exercise increased caution in Panama due to crime and potential for civil unrest. Some areas have increased risk. Read the entire travel advisory.
Do not travel to:
- Parts of the Mosquito Gulf due to crime.
- Parts of the Darién Region due to crime.
Read the country information page for additional information on travel to Panama.
Country Summary: Crime occurs in Panama, including theft and residential break-ins. Crimes of opportunity such as pickpocketing and purse snatching can happen in tourist areas. The Embassy receives occasional reports of residential break-ins, especially during the holiday season.
Demonstrations periodically occur due to local issues and have disrupted some normal travel patterns in the past, including the flow of goods and services to some parts of the country.
If you decide to travel to Panama:
The U.S. government has limited ability to provide emergency services to U.S. citizens in the below regions as U.S. government personnel must obtain approval before traveling there and face additional restrictions before such travel is approved.
Parts of the “Mosquito Gulf” – Level 4: Do Not Travel
The “Mosquito Gulf” is an extremely remote and inaccessible area along part of the north (Caribbean) coast.
Do not travel within 10 miles of the coastline, from Boca de Rio, Chiriqui to Cocle del Norte. Drug trafficking and other illicit activities occur in this area.
Parts of the Darién Region – Level 4: Do Not Travel
Do not travel to the following areas of the Darien:
- All areas south of Jaque to Manene to Yaviza to Lajas Blancas cities to the Colombian border
- The city of Lajas Blancas
- The city of El Salto
Criminal activity and human trafficking networks operate in these areas. Police presence and emergency response are extremely limited.
Visit our website for Travel to High-Risk Areas.
Date Issued: Tue, 29 Apr 2025
Reissued after periodic review with minor edits.
Reconsider travel to Papua New Guinea due to crime, civil unrest, and piracy. Exercise increased caution due to kidnapping, unexploded ordnance, inconsistent availability of healthcare services, and potential for natural disasters. Some areas have increased risk. Read the entire Travel Advisory.
Do not travel to:
- Central Bougainville, particularly areas near the Panguna mine, due to civil unrest.
- The Highlands region, other than the towns of Mt. Hagen and Goroka, due to civil unrest.
Country Summary: Violent crime, including sexual assault, carjackings, home invasions, and armed robberies, is common. There have been reports of criminals attacking resorts popular with foreign tourists to steal goods and money. Tensions between communal or tribal groups may lead to civil unrest involving violence and can occur without warning. Police presence is limited outside of the capital, Port Moresby, and police may be unable to assist due to limited resources.
The U.S. government has limited ability to provide emergency services to U.S. citizens outside of Port Moresby due to limited transportation infrastructure. U.S. government employees must obtain authorization before traveling to certain areas, including the central part of Bougainville and the provinces of Southern Highlands, Western Highlands (excluding Mt. Hagen), Eastern Highlands (excluding Goroka), Hela, Enga, Jiwaka, and other areas of Papua New Guinea where one is unable to fly directly.
Piracy is active in the waters surrounding Papua New Guinea. Travelers by boat should reconsider travel to the Bismarck and Solomon Seas along Papua New Guinea’s north and eastern coasts. In 2021 and 2022, the Embassy was aware of at least three occasions in which sailboats operated by or carrying U.S. citizens were boarded by criminals. The criminals, who have been known to use physical violence, robbed the boats, and in one incident, severely injured the captain when he attempted to fight back.
Visit our website on International Maritime Piracy and Armed Robbery at Sea.
Kidnapping for ransom or political influence occurs in Papua New Guinea, though foreign nationals are not frequently targeted. In February 2023, a foreign national was kidnapped. In late 2022, foreign nationals employed by an international company were kidnapped and held for several days.
Travelers should exercise increased caution when traveling in remote areas of Papua New Guinea due to the presence of unexploded ordnance (UXO) remaining from the Second World War. UXO is discovered infrequently throughout the country, often on smaller islands.
Papua New Guinea has inconsistent availability of healthcare services. Healthcare may be difficult to obtain outside of Port Moresby. Pharmaceuticals may be scarce or unavailable.
Papua New Guinea is subject to periodic seismic activity and is home to several active volcanoes. The country does experience regular volcanic eruptions, earthquakes, and tsunamis. U.S. citizens are advised to familiarize themselves with volcano updates, earthquake tracking, and tsunami warnings in Papua New Guinea. U.S. citizens should develop contingency plans in the event of an eruption or major earthquake.
Read the country information page for additional information on travel to Papua New Guinea.
If you decide to travel to Papua New Guinea:
- Do not use local taxis or buses, known as public motor vehicles or PMVs.
- Travel with guides from a reputable tour company, particularly if you plan to hike.
- Avoid walking or driving at night.
- Avoid areas in the vicinity of active volcanoes.
- Do not physically resist any robbery attempt.
- Avoid demonstrations and crowds.
- Do not touch unknown metal objects and avoid traveling off well-used roads, tracks, and paths due to risk of unexploded ordnance.
- Bring a sufficient supply of over-the-counter and prescription medicines.
- Avoid sailing around the waters of Papua New Guinea and review the Live Piracy Report published by the International Maritime Bureau.
- If sailing, have functioning communication and emergency equipment, such as a satellite phone, VHF radio, and emergency position indicating radio beacons (EPIRB).
- Review our crisis and disaster abroad webpage.
- Review the CDC’s suggestions on preparing for natural disasters.
- Enroll in the Smart Traveler Enrollment Program (STEP) to receive messages and Alerts from the U.S. Embassy and make it easier to locate you in an emergency.
- Review the Country Security Report for Papua New Guinea.
- Visit the CDC page for the latest Travel Health Information related to your travel.
- Prepare a plan for emergency situations. Review the Traveler’s Checklist.
- We highly recommend that you buy insurance before you travel. Check with your travel insurance provider about evacuation assistance, medical insurance, and trip cancellation coverage.
Areas Near the Panguna Mine on the island of Bougainville – Level 4: Do Not Travel
The Autonomous Bougainville Government has designated areas near the Panguna mine as a “no go zones” due to the risk of violence from civil unrest. Bougainville police lack the resources to respond to emergency calls.
Visit our website for Travel to High-Risk Areas. Do not travel to this area for any reason.
The Highlands Region (excluding Mt. Hagen and Goroka) – Level 4: Do Not Travel
There is a heightened risk of civil unrest from tribal violence throughout the region, including the provinces of Southern Highlands, Western Highlands, Eastern Highlands, Hela, Enga, and Jiwaka. The towns of Mt. Hagen (Western Highlands) and Goroka (Eastern Highlands) generally have a more stable police presence than other towns and villages across the Highlands provinces. Do not travel to this area for any reason.
Visit our website for Travel to High-Risk Areas.
Date Issued: Wed, 30 Apr 2025
Reissued after periodic review with minor edits.
Exercise normal precautions in Paraguay. Some areas have increased crime risk. Read the entire Travel Advisory.
Exercise increased caution due to crime in these departments:
- Alto Paraná
- Amambay
- Canindeyu
- Concepcion
- San Pedro
Read the country information page for additional information on travel to Paraguay.
If you decide to travel to Paraguay:
Departments of Alto Paraná, Amambay, Canindeyu, Concepcion, and San Pedro – Level 2: Exercise Increased Caution
Criminal groups are active in these areas, smuggling weapons, drugs, and other goods along the northeastern border of Paraguay with Brazil. The police presence in these areas is weak. Due to the risks, U.S. government employees working in Paraguay must obtain special authorization to travel to Alto Paraná, Amambay, Canindeyu, Concepcion, and San Pedro.
Date Issued: Fri, 16 May 2025
Reissued after periodic review with minor edits.
Exercise increased caution due to crime, civil unrest, and the risk of kidnapping. Some areas have increased risk. Read the entire Travel Advisory.
Do not travel to:
- The Colombia-Peru border area in the Loreto Region due to crime.
- The Valley of the Apurímac, Ene, and Mantaro Rivers (VRAEM), which includes Vilcabamba, due to crime and threats of terrorism.
- Some areas within the regions of Ayacucho, Cusco*, Huancavelica, and Junín, due to crime and threats of terrorism.
* The city of Cusco and popular tourist sites nearby, like the Sacred Valley, the Inca Trail, and Machu Picchu, are not located in the affected area.
Country Summary: Crime is common in Peru. Petty theft, carjackings, muggings, assaults, and other violent crime often happen even in daylight hours and with many witnesses around. Kidnapping is rare, but it does occur. The risk of crime increases at night. Criminal groups sometimes set up roadblocks to rob people in areas outside of Lima.
Ayahuasca and Kambo Usage
U.S. travelers should not use Ayahuasca or Kambo because of the known dangers. U.S. citizens have suffered serious illness and, in some cases, died after taking these drugs. They have also been sexually assaulted, injured, or robbed while under the influence of these substances.
Demonstrations
Demonstrations occur regularly throughout the country. Public demonstrations can take place for a variety of political and economic issues. Demonstrations can shut down local roads, trains, and major highways. This often happens without warning or clear information on reopening times. Road closures can limit access to public transportation and airports. Closures may also disrupt travel in and between cities.
Due to road safety risks, U.S. government employees working in Peru are prohibited from nighttime driving except within cities, between Lima and Huacho (to the north), and Lima and Paracas (to the south). U.S. government employees working in Peru may travel at night with commercial bus companies along the Pan-American Highway, to Huaraz, and on the Lima-Arequipa-Cusco corridor.
Read the country information page for additional information on travel to Peru.
If you decide to travel to Peru:
- Stay aware of your surroundings.
- Visit our website for Travel to High-Risk Areas.
- Check local media for breaking news. Be prepared to adjust your plans.
- Avoid demonstrations and large crowds.
- Develop a communication plan with family or your employer or host organization (if you are traveling on business), so that they can monitor your safety and location as you travel through high-risk areas. Specify how you’ll confirm you’re safe (text, calls, etc.), how often, and who you’ll contact first to share the information.
- Enroll in the Smart Traveler Enrollment Program (STEP) to receive messages and Alerts from the U.S. Embassy and make it easier to locate you in an emergency.
- Review the Country Security Report for Peru.
- Prepare a plan for emergency situations. Review the Traveler’s Checklist.
- Visit the CDC page for the latest Travel Health Information related to your travel and return to the United States.
- We strongly recommend that you buy insurance before you travel. Check with your travel insurance provider about evacuation assistance, medical insurance, and trip cancellation coverage.
Colombian-Peruvian border area in the Loreto Region – Level 4: Do Not Travel
- Do not travel to these areas for any reason.
- Drug trafficking and crime, plus poor infrastructure, limit how well Peruvian law enforcement can operate in this area.
- Due to the risks, U.S. government employees working in Peru must obtain special authorization to travel within 20 kilometers of the Peru-Colombia border in the Loreto region. They cannot travel on the Putumayo River, which forms much of the Peru-Colombia border. Due to the risks, the U.S. government cannot provide emergency services to U.S. citizens in this area.
Valley of the Apurímac, Ene, and Mantaro Rivers (VRAEM) includes areas within the Departments of Ayacucho, Cusco, Huancavelica, and Junín – Level 4: Do Not Travel
- Do not travel to these areas for any reason.
- Drug trafficking and crime, plus poor infrastructure, weaken Peruvian law enforcement’s ability to act effectively in this area.
- Remnants of the Shining Path terrorist group are still active in the VRAEM. The group might strike suddenly. They target Peruvian government sites and staff.
- Due to security risks, U.S. government employees working in Peru must obtain special authorization to travel to the VRAEM. Due to the risks, the U.S. government can’t provide emergency services to U.S. citizens in the VRAEM.
Date Issued: Thu, 08 May 2025
Reissued after periodic review with minor edits.
Exercise increased caution in the Philippines due to crime, terrorism, civil unrest, and kidnapping. Some areas have increased risk. Read the entire Travel Advisory.
Do Not Travel to:
- The Sulu Archipelago, including the southern Sulu Sea, due to crime, terrorism, civil unrest, and kidnapping.
- Marawi City in Mindanao due to terrorism and civil unrest.
Reconsider Travel to:
- Other areas of Mindanao due to crime, terrorism, civil unrest, and kidnapping.
Country Summary: Terrorists and armed groups have carried out kidnappings, bombings, and other attacks targeting public areas like tourist sites, markets, and local government facilities in the Philippines. Violent crimes are also common in the Philippines such as robbery, kidnappings, and physical assaults. Protests happen in the Philippines and could turn violent and/or result in traffic jams and road closures with limited capacity of the local government to respond.
Due to the risks, U.S. government employees working in the Philippines must obtain special authorization to travel to certain areas of the country as stated below.
Read the country information page for additional information on travel to the Philippines.
If you decide to travel to the Philippines:
The Sulu Archipelago and Sulu Sea – Level 4: Do Not Travel
Do not travel to these areas for any reason.
Terrorist and armed groups in the Sulu Archipelago and the Sulu Sea have historically engaged in kidnappings for ransom on land and at sea, in addition to bombings and other attacks. These incidents often target foreign nationals, including U.S. citizens, local government entities, and security personnel.
Due to the risks, U.S. government employees working in the Philippines must obtain special authorization to travel to Sulu Archipelago and Sulu Sea. The U.S. government has limited ability to provide emergency services to U.S. citizens in these areas.
Visit our website for Travel to High-Risk Areas.
Marawi City in Mindanao – Level 4: Do Not Travel
Do not travel to these areas for any reason.
Civilians face risk of death or injury from ongoing clashes between terrorist group remnants and Philippine security forces in Marawi.
Due to the risks, U.S. government employees working in the Philippines must obtain special authorization to travel to Marawi City. The U.S. government has limited ability to provide emergency services to U.S. citizens there.
Visit our website for Travel to High-Risk Areas.
Mindanao (except Davao City, Davao del Norte Province, Siargao Island, and the Dinagat Islands) – Level 3: Reconsider Travel
Terrorist and armed groups in Mindanao have historically engaged in kidnappings for ransom, in addition to bombings and other attacks. These incidents often target foreign nationals, including U.S. citizens, as well as civilians, local government entities, and security forces.
Due to the risks, U.S. government employees working in the Philippines must obtain special authorization to travel to areas outside of Davao City, Davao del Norte Province, Siargao Island, and the Dinagat Islands. The U.S. government has limited ability to provide emergency services to U.S. citizens in those areas.
Visit the U.S. Department of State’s country reports on terrorism to learn more.
Visit our website for Travel to High-Risk Areas.
Date Issued: Thu, 05 Jun 2025
Reissued after periodic review with minor edits.
Exercise normal precautions in Poland.
Read the country information page for additional information on travel to Poland.
If you decide to travel to Poland:
Date Issued: Tue, 23 Dec 2025
Exercise normal precaution in Portugal.
- Portugal is generally a safe destination for travelers. Travelers should remain vigilant against petty theft, particularly in crowded tourist areas and on public transportation.
- Review our travel guidance for Portugal to learn how to prepare for a safe trip.
Date Issued: Tue, 03 Jun 2025
Updated after periodic review with minor edits.
Exercise normal precautions in Qatar.
The Federal Aviation Administration (FAA) has issued a Notice to Airmen (NOTAM) and/or a Special Federal Aviation Regulation (SFAR) for the region, including Qatar. This is due to risks to civil aviation from political and military tensions in the region. The notice advises U.S. operators to review current threat information and to report safety or security incidents. For more information, U.S. citizens should consult the Federal Aviation Administration.
Read the country information page for additional information on travel to Qatar.
If you decide to travel to Qatar:
Date Issued: Wed, 02 Oct 2024
Reissued after periodic review with minor updates.
Exercise increased caution in the Republic of the Congo due to crime.
Country Summary: While not common, violent crime, such as armed robbery and assault, remains a concern throughout the Republic of the Congo.
The U.S. government has limited ability to provide emergency services to U.S. citizens outside Brazzaville. U.S. government employees must use two vehicles for all overland travel outside Brazzaville. In Pointe-Noire, they are restricted to beaches adjacent to their hotels due to crime.
Read the country information page for additional information on travel to the Republic of Congo.
If you decide to travel to the Republic of the Congo:
Date Issued: Tue, 14 Oct 2025
There were no changes to the advisory level or risk indicators. Advisory summary was updated.
Advisory Summary
- Exercise normal precautions in Romania.
- Romania has moderate seismic activity and a history of strong earthquakes. Bucharest faces the highest risk.
If you decide to travel to Romania:
Date Issued: Mon, 29 Dec 2025
Do not travel to Russia for any reason due to terrorism, unrest, wrongful detention and other risks.
U.S. citizens in Russia should leave immediately
The U.S. government has limited ability to help U.S. citizens in Russia, especially outside of Moscow. The U.S. Embassy in Moscow has reduced its staff. The Russian government has also restricted travel for embassy personnel. All U.S. consulates in Russia have suspended operations, including consular services.
Do not travel to Russia for any reason
The U.S. Embassy in Moscow has limited ability to assist in the case of a detention of a U.S. citizen. There is no guarantee that the Russian government will grant the U.S. Embassy consular access to detained U.S. citizens. U.S. citizens may serve their entire prison sentence without release. The risk of wrongful detention of U.S. citizens remains high. Even if a case is determined wrongful, there is no guarantee of release.
Russian officials often question and threaten U.S. citizens without reason. Russian security services have arrested U.S. citizens on false charges. They have denied them fair treatment and convicted them without credible evidence. Russian authorities have opened questionable investigations against U.S. citizens for their religious activities.
There have been drone attacks and explosions near the border with Ukraine, and in Moscow, Kazan, St. Petersburg, and other large cities. In 2024, ISIS Khorasan claimed responsibility for the attack at Crocus Music Hall in Moscow. This attack killed 130 people. They also targeted places of worship in Dagestan. In an emergency, you should follow instructions from local authorities and seek shelter.
Dual citizenship
Russia will not recognize your U.S. citizenship if you are a dual U.S.-Russian citizen or have a claim to Russian citizenship.
- Russia has blocked U.S. consular officers from visiting detained dual U.S.-Russian citizens.
- The Russian government has forced dual citizens to join the military. They also have stopped them from leaving the country.
- In 2022, Russia started drafting citizens for the war in Ukraine. The military draft is ongoing.
- Failure to adhere to Russian laws and regulations on dual citizenship can result in arrest.
Demonstrations
In Russia, peaceful assembly and freedom of speech are not protected rights. U.S. citizens should avoid protests and taking photos of security staff at these events. Russian authorities have arrested U.S. citizens who have joined protests. Russians and U.S. citizens have been detained for posts on social media.
Electronic devices
Reconsider bringing electronic devices into Russia. U.S. citizens should assume all electronic communications and devices in Russia are monitored by Russian security services. Russian security services have arrested U.S. citizens and other foreign nationals based on information found on electronic devices. This includes information that was created, transmitted, or stored while in another country.
Debit and credit cards
U.S. credit and debit cards no longer work in Russia. Due to sanctions, sending electronic money transfers from the United States to Russia is nearly impossible. The U.S. Embassy cannot assist with transferring money to circumvent sanctions.
Air travel
There are few commercial air travel options available. It may not be easy to book flights on short notice. If you wish to leave Russia, you should make your own travel plans. The U.S. Embassy can only offer limited help to U.S. citizens trying to leave. Transportation options could become even more limited at any time.
The Federal Aviation Administration (FAA) has downgraded Russia’s air safety rating from Category 1 to Category 2 due to safety concerns. U.S. government personnel are generally not allowed to fly on Russian airlines due to safety concerns.
Additionally, the FAA banned U.S. flights within certain areas of Russian airspace, by issuing a Notice to Airmen (NOTAM). This is due to risks to civil aviation operating within or in the vicinity of these certain areas. For more information U.S. citizens should consult the Federal Aviation Administration’s Prohibitions, Restrictions and Notices.
Laws and special circumstances
Russian officials have questioned, threatened, and detained U.S. citizens without reason. This includes both former and current U.S. government and military personnel, as well as private U.S. citizens. Russian authorities have a history of wrongfully detaining U.S. nationals and using them as bargaining chips.
- U.S. citizens may become victims of harassment, mistreatment, and extortion.
- Russian authorities do not always notify the U.S. embassy about the detention of a U.S. citizen. They may delay or deny U.S. consular help.
- Russian security services target foreign nationals and international organizations considered “undesirable.”
- Russian law allows authorities to punish foreigners for treason. This includes working for organizations that Russia perceives as acting against Russian interests. Former and current U.S. government employees and contractors should pay special attention to this part of Russian law.
Security
Drone attacks and explosions have taken place near the border with Ukraine and in Moscow, Kazan, St. Petersburg, and other large cities. In an emergency, you should follow instructions from local authorities and seek shelter.
Russia’s war in Ukraine has destabilized security in southwestern Russia. In October 2022, the Russian government declared martial law in the following border areas with Ukraine: Bryansk, Kursk, Belgorod, Voronezh, Rostov, and Krasnodar.
Under martial law, authorities can:
- Set curfews
- Seize property
- Restrict movement
- Detain foreigners
- Forcibly relocate residents
- Limit public gatherings
Russian authorities have questioned, detained, and arrested people for “acting against Russia’s interests.” Local authorities have targeted people for posting on social media or supporting “anti-Russian” groups. They have punished people for criticizing the government or military.
Gay and lesbian travelers
The Russian government’s “propaganda” law bans discussion of gay and lesbian topics. The community has been labeled as “extremist,” and it is considered a crime to support the human rights of gay and lesbian people in Russia. Displaying certain symbols, including the rainbow flag, is a crime. Foreigners found guilty of violating this law may be arrested and detained for up to 15 days and then deported.
Terrorism
Terrorists continue to plan and carry out attacks in Russia. The March 2024 Crocus City Hall attack in Moscow proved terrorists can strike without warning.
U.S. government employees working in Russia are prohibited from traveling to the North Caucasus, including Chechnya and Mt. Elbrus.
Russian annexation of territories
The international community does not recognize Russia’s purported annexation of Crimea, Donetsk, Luhansk, Kherson, and Zaporizhzhya.
Russia staged its full-scale invasion of Ukraine, in part, from occupied Crimea. There is a heavy Russian military presence in these areas and intense fighting across these regions.
Russian authorities have abused foreigners and locals. In particular, they have targeted people who they see as opposing Russia’s authority.
The U.S. Embassy in Kyiv, Ukraine offers consular services to U.S. citizens in Crimea, Donetsk, Luhansk, Kherson, and Zaporizhzhya. However, the ongoing war limits the embassy’s ability to help U.S. citizens in these areas.
Date Issued: Wed, 16 Jul 2025
Updated to remove the Level 4: Do Not Travel area near the border with Burundi and to reflect changes to the Level 4: Do Not Travel areas near the border with the Democratic Republic of the Congo.
Exercise increased caution in Rwanda due to the potential for armed violence. Some areas have an increased risk. Read the entire Travel Advisory.
Do Not Travel to:
- Rusizi District within 10 kilometers of the Democratic Republic of the Congo (DRC) border due to armed violence.
- Rubavu District within 10 kilometers of the DRC border due to armed violence.
Country Summary: Armed groups, individuals, and military forces routinely clash in nearby countries. The ongoing violence in these areas raises the risk of spilling over into Rwanda.
Read the country information page for additional information on travel to Rwanda.
If you decide to travel to Rwanda:
Rusizi District within 10 kilometers of the DRC border – Level 4: Do Not Travel
- Lake Kivu borders the DRC. Borders may not be clearly marked. A permit from the Rwanda Development Board is required for entry to Nyungwe Forest National Park.
- Due to the risks, U.S. government employees working in Rwanda must obtain special authorization to travel to Rusizi District.
Visit our website for Travel to High-Risk Areas.
Rubavu District within 10 kilometers of the DRC border – Level 4: Do Not Travel
- Armed groups operate in the DRC’s North and South Kivu provinces and Virunga Park. This is next to Rwanda’s Volcanoes National Park. The area has faced increasing armed conflict, which might spread across a poorly marked border.
- To enter the Volcanoes National Park in Rwanda, you need a permit from the Rwanda Development Board.
- Due to the risks, U.S. government employees working in Rwanda must obtain special authorization to travel to Rubavu District.
Visit our website for Travel to High-Risk Areas.
Date Issued: Mon, 19 Aug 2024
Reissued after periodic review without changes.
Exercise normal precautions in Saba.
Read the country information page for additional information on travel to Saba.
If you decide to travel to Saba:
Date Issued: Thu, 22 Aug 2024
Reissued after periodic review with minor edits.
Exercise normal precautions in St. Kitts and Nevis.
Read the country information page for additional information on travel to St. Kitts and Nevis.
If you decide to travel to St. Kitts and Nevis:
Date Issued: Thu, 22 Aug 2024
Reissued after periodic review with minor edits.
Exercise normal precautions in Saint Lucia.
Read the country information page for additional information on travel to Saint Lucia.
If you decide to travel to Saint Lucia:
Date Issued: Fri, 06 Dec 2024
Updated to add Petit Saint Vincent to the list of islands affected by Hurricane Beryl in July 2024.
Exercise normal precautions in Saint Vincent and the Grenadines. The islands of Canouan, Mayreau, Palm Island, Petit Saint Vincent, and Union Island are in varying stages of recovery from Hurricane Beryl.
Read the country information page for additional information on travel to Saint Vincent and the Grenadines.
If you decide to travel to St. Vincent and the Grenadines:
Canouan, Mayreau, Palm Island, Petit Saint Vincent, and Union Island
In July 2024, Hurricane Beryl damaged many buildings on these islands. Until repairs are complete, fewer hotels and transportation options may be available.
- Contact your destination before traveling to these islands
Date Issued: Mon, 10 Mar 2025
Reissued after periodic review with minor edits.
Exercise normal precautions in Samoa.
Read the country information page for additional information on travel to Samoa.
If you decide to travel to Samoa:
Date Issued: Wed, 08 Oct 2025
Exercise Increased Caution in São Tomé and Príncipe due to health risks.
Medical services in São Tomé and Príncipe are limited. There are no adequate trauma or ambulance services. Even minor health issues may require medical evacuation at the traveler’s expense. Review our information on Travel Insurance.
- If you decide to travel to São Tomé and Príncipe:
- Medical services for routine and emergency procedures are limited. Read the Health section of the Travel Guidance on this page for more information.
- Make sure you have medical or travel insurance that includes medical evacuation. Review our information on Travel Insurance.
- Check with your doctor about required vaccines and shots for high-risk exposure before you go to São Tomé and Príncipe.
- Bring enough supply of over the counter and prescription medicines to cover the duration of the trip.
- Have sufficient access to cash (U.S. dollars or local currency) to pay for medical services as credit or debit cards are not widely accepted by medical facilities.
- Enroll in the Smart Traveler Enrollment Program (STEP) to get important updates and alerts from the U.S. embassy or consulate. Enrolling helps the U.S. embassy or consulate contact you or your emergency contact in an emergency.
- Review the Country Security Report for São Tomé and Príncipe.
- Visit the Centers for Disease Control and Prevention (CDC) website for the latest Travel Health Information for São Tomé and Príncipe.
- Whether you’re a first time or frequent traveler, use the International Travel Checklist.
- We highly recommend that you buy travel insurance before you travel. Check with your travel insurance provider about evacuation assistance, medical insurance, and trip cancelation coverage.
Date Issued: Mon, 09 Sep 2024
Updated to reflect current security conditions and other minor edits.
Exercise increased caution in Saudi Arabia due to the threat of missile and drone attacks from Yemen and terrorism. Some areas have increased risk. Read the entire Travel Advisory. Be aware of risks concerning social media activity and importation of prohibited items.
Do not travel to the following locations due to the threat of missile and drone attacks and terrorism:
- Within 20 miles of the Saudi-Yemen border, including the city of Najran
- Qatif in the Eastern Province and its suburbs, including Awamiyah.
Country Summary: U.S. Embassy and Consulate personnel must adhere to the above travel restrictions. The U.S. government has limited ability to assist U.S. citizens in the above locations.
The Houthis have perpetrated missile and drone attacks in Saudi Arabia. Attacks have been rare since the announcement of a truce between Saudi Arabia, the Houthi rebels, and the internationally recognized Government of Yemen. Recent Houthi attacks have focused on vessels in Red Sea shipping lanes. The Houthis have also threatened to renew attacks against Saudi Arabia. Past attacks have been aimed at targets throughout the country. Cities, infrastructure, airports, military bases and energy facilities have all been targeted.
Debris from intercepted drones and missiles has also been a risk. U.S. citizens living and working near infrastructure and military bases and infrastructure are at increased risk if attacks reoccur. The risk is most pronounced near the border with Yemen.
Terrorism continues to be a concern in Saudi Arabia. Attacks can occur with little or no warning. Terrorists have targeted Saudi and international interests. Religious sites and other places frequented by U.S. citizens have been targeted. Globally, terrorists are using less sophisticated methods of attack – including knives, firearms, and vehicles. Targets often include tourist locations, large gatherings, transportation hubs, markets, shopping malls, and government facilities. Terrorists are also known to time attacks around major holidays and/or in response to military operations.
Social media activity Saudi authorities deem critical, offensive, or disruptive to public order, could lead to arrest. U.S. citizens have been arrested for past social media activity and comments made while outside of Saudi Arabia. This may include posting, re-posting, or liking comments critical of Saudi institutions, policies, or public life. Saudi laws on cybercrime and terrorism are used to prosecute these cases. Punishment for social media activity has included prison sentences of up to 45 years. Saudi courts do not necessarily consider the timeframe of the posts, or the location from which they were made, to be material.
It is illegal to bring drugs (including marijuana), drug paraphernalia, or alcohol into Saudi Arabia. Importing gambling-related items, weapons, or pork is prohibited. Bringing materials that could be considered obscene or suggestive into Saudi Arabia is also prohibited. Penalties are severe by U.S. standards. For more information, please see the Saudi Arabia Customs Authority website.
Due to risks to civil aviation operating within the Persian Gulf and the Gulf of Oman region, including Saudi Arabia, the Federal Aviation Administration (FAA) has issued an advisory Notice to Air Missions (NOTAM). For more information U.S. citizens should consult the Federal Aviation Administration’s Prohibitions, Restrictions and Notices.
Read the country information page for additional information on travel to Saudi Arabia.
If you decide to travel to Saudi Arabia:
Travel within 20 miles of the Yemen Border and Qatif in the Eastern Province, including Awamiyah – Level 4: Do Not Travel
Militants in Yemen have attacked Saudi border towns and other sites in Saudi Arabia with armed drones, missiles, and rockets. Civilians that are near the border with Yemen are especially at risk. Terrorist groups continue plotting possible attacks in Saudi Arabia, including in Qatif.
U.S. Embassy and Consulate personnel and their families are restricted from traveling within 20 miles of the Saudi-Yemen border. The U.S. government has limited ability to assist U.S. citizens in this area.
Visit our website for information on travel to high-risk areas
Date Issued: Mon, 01 Dec 2025
There were no changes to the advisory level or risk indicators. Advisory summary was updated.
Exercise normal precautions in Senegal.
Exercise increased caution in the Casamance region due to crime and landmines. Some areas have increased risk. Read the entire Travel Advisory.
Advisory Summary
Senegal is generally a safe destination for travelers. Read our travel guidance for Senegal to learn how to prepare for a safe trip.
Level 2 – Exercise Increased Caution
Casamance region
Exercise Increased Caution in the Casamance region due to crime and landmines.
U.S. embassy personnel can only travel in the Casamance region on main roads and during daylight hours.
Crime
Separatist rebel groups operate in the Casamance region. Bandits sometimes commit armed robbery in the area. Stay on main roads and do not travel at night.
Landmines
Landmines and unexploded ordinance from prior conflicts exist in the Casamance region, primarily in border and rural areas. The locations of landmines and unexploded ordnance are often not known, marked, or easy to recognize.
If you decide to travel to Senegal:
- Review our information on Crime Abroad and for Victims of Crime.
- Do not physically resist any robbery attempt.
- Use caution when walking or driving at night.
- Be aware of your surroundings.
- Do not display signs of wealth, such as expensive watches or jewelry.
- Do not visit locations where landmines are known to exist. Be alert to signs that mark unexploded landmines. Stay on main roads and well-traveled areas.
- Enroll in the Smart Traveler Enrollment Program (STEP) to get important updates and alerts from the U.S. embassy or consulate. Enrolling helps the U.S. embassy or consulate contact you or your emergency contact in an emergency.
- Review the Country Security Report for Senegal.
- Visit the Centers for Disease Control and Prevention (CDC) website for the latest Travel Health Information for Senegal, including which vaccines are recommended prior to your travel.
- Whether you’re a first time or frequent traveler, use the International Travel Checklist.
- We highly recommend that you buy travel insurance before you travel. Check with your travel insurance provider about evacuation assistance, medical insurance, and trip cancelation coverage.
Date Issued: Fri, 11 Apr 2025
Reissued with minor changes.
Exercise increased caution in Serbia due to crime.
Country Summary: Violence associated with organized crime and high-profile sporting events in Serbia is common.
Read the country information page for additional information on travel to Serbia.
If you decide to travel to Serbia:
- Be aware of your surroundings.
- Do not display signs of wealth, such as expensive watches or jewelry.
- Do not answer your door at your hotel/residence unless you know who it is.
- Stay alert in locations frequented by Westerners.
- Be extra vigilant when visiting banks or ATMs.
- Carry a copy of your passport and visa (if applicable) and leave the original in your hotel safe.
- Provide your itinerary to a family member or friend.
- Monitor local media.
- Enroll in the Smart Traveler Enrollment Program (STEP) to receive Alerts and make it easier to locate you in an emergency.
- Review the Country Security Report for Serbia.
- Prepare a contingency plan for emergency situations. Review the Traveler’s Checklist.
- Visit the CDC page for the latest Travel Health Information related to your travel.
- We highly recommend that you buy insurance before you travel. Check with your travel insurance provider about evacuation assistance, medical insurance, and trip cancellation coverage.
Date Issued: Tue, 09 Dec 2025
There was no change to the advisory level. An area of increased risk was added. Advisory summary was updated.
Exercise Normal Precautions in Seychelles. Some areas have increased risk. Read the entire Travel Advisory.
Advisory summary
Seychelles is generally a safe destination for travelers. Read our travel guidance for Seychelles to learn how to prepare for a safe trip. The United States does not maintain a consular presence in Seychelles. Contact the U.S. embassy in Port Louis, Mauritius, if you need help in an emergency while in Seychelles.
Level 2 – Exercise Increased Caution – Praslin, La Digue, and the outer islands
Exercise Increased Caution in Praslin, La Digue, and the outer islands due to health risks. Smaller islands like these lack medical infrastructure required to treat common traumas or illnesses. Patients must travel to the island of Mahé via boat or plane to receive care.
If you decide to travel to Seychelles:
- Enroll in the Smart Traveler Enrollment Program (STEP) to get important updates and alerts from the U.S. embassy or consulate. Enrolling helps the U.S. embassy or consulate contact you or your emergency contact in an emergency.
- Review the Country Security Report for Seychelles.
- Visit the Centers for Disease Control and Prevention (CDC) website for the latest Travel Health Information for Seychelles.
- Whether you’re a first time or frequent traveler, use the International Travel Checklist.
- We highly recommend that you buy travel insurance before you travel. Check with your travel insurance provider about evacuation assistance, medical insurance, and trip cancelation coverage.
- Make sure you have medical or travel insurance that includes medical evacuation coverage. Review our information on Travel Insurance.
Date Issued: Mon, 15 Sep 2025
Exercise increased caution in Sierra Leone due to crime, civil unrest, and inadequate health infrastructure.
Advisory Summary:
Crime
Violent crimes, such as robbery and assault, occur frequently in Sierra Leone, especially in Freetown. Police struggle to respond to serious crime in most places due to limited resources.
Do not travel outside the Freetown peninsula after nightfall. There are increased safety hazards and security concerns at night. U.S. government employees in Sierra Leone are prohibited from travel outside the capital after dark. The U.S. Embassy in Freetown cannot offer emergency services outside Freetown at night.
Review our information on Crime Abroad and for Victims of Crime.
Unrest
Demonstrations and protests occur in Sierra Leone and occasionally result in violence. Protests can happen with little to no warning. They often develop around political issues, large events, or holidays.
Health
Sierra Leone’s health infrastructure is inadequate. Health facilities, services, hygiene, and quality control do not meet U.S. standards of care. Pharmacies are not well regulated. Locally available medications may be unsafe.
Make sure you have medical or travel insurance that includes medical evacuation. Be sure to bring enough prescription medications to last the entire duration of your trip. Review our information on Travel Insurance.
If you decide to travel to Sierra Leone:
- Avoid demonstrations and crowds.
- Stay aware of your surroundings.
- Do not display signs of wealth, such as expensive watches, jewelry, or smartphones.
- Use caution when walking or driving at night.
- Do not physically resist any robbery attempt.
- Be extra vigilant when visiting banks or ATMs.
- Keep travel documents up to date and easily accessible.
- Check with your doctor about required vaccines and shots for high-risk exposure before you go to Sierra Leone. Review the Health section in the Travel Guidance for Sierra Leone.
- Enroll in the Smart Traveler Enrollment Program (STEP) to get important updates and alerts from the U.S. embassy or consulate. Enrolling helps the U.S. embassy or consulate contact you or your emergency contact in an emergency.
- Review the Country Security Report for Sierra Leone.
- Visit the Centers for Disease Control and Prevention (CDC) website for the latest Travel Health Information for Sierra Leone.
- Whether you’re a first time or frequent traveler, use the International Travel Checklist.
- We highly recommend that you buy travel insurance before you travel. Check with your travel insurance provider about evacuation assistance, medical insurance, and trip cancelation coverage.
Date Issued: Wed, 05 Mar 2025
Reissued after periodic review with minor edits.
Exercise normal precautions in Singapore.
Read the country information page for additional information on travel to Singapore.
If you decide to travel to Singapore:
Date Issued: Mon, 19 Aug 2024
Reissued after periodic review without changes.
Exercise normal precautions in Sint Eustatius.
Read the country information page for additional information on travel to Sint Eustatius.
If you decide to travel to Sint Eustatius:
Date Issued: Mon, 19 Aug 2024
Reissued after periodic review without changes.
Exercise normal precautions in Sint Maarten.
Read the country information page for additional information on travel to Sint Maarten.
If you decide to travel to Sint Maarten:
Date Issued: Thu, 14 Nov 2024
Reissued after periodic review with minor edits.
Exercise normal precautions in Slovakia.
Read the country information page for additional information on travel to Slovakia.
If you decide to travel to Slovakia:
Date Issued: Fri, 26 Jul 2024
Reissued after periodic review without changes
Exercise normal precautions in Slovenia.
Read the country information page for additional information on travel to Slovenia.
If you decide to travel to Slovenia:
Date Issued: Tue, 29 Apr 2025
Reissued after periodic review with updated risk information.
Exercise increased caution traveling to Solomon Islands due to risks to health, unexploded ordinance, crime and civil unrest.
Mosquito-borne diseases such as malaria and dengue fever are widespread. Medical facilities and clinics outside of Honiara are under-resourced in terms of drugs and medical equipment.
Unexploded ordinance (UXO) from World War II remains a significant hazard and may be present on land, in forests, and underwater locations. Many areas have been swept or cleared, however previously undetected UXO continue to be discovered on a regular basis. While some areas are much more dangerous than others, caution is advised, even in areas reported to be cleared. High-risk areas include:
- Hell’s Point and the ridges behind Honiara
- New Georgia group of islands
- Russell Islands
- Tulagi Island
While petty crime is common in some parts of Solomon Islands, Honiara has a higher risk of petty crime, break-ins, robbery, and sexual assault, including incidents targeting foreigners. Travelers should remain vigilant, avoid displaying valuables in public, and be cautious in less populated or poorly lit areas. Other violent crimes are uncommon but can occur.
Civil unrest can arise with little notice. Political developments, including Parliament sittings, elections, and times of political uncertainty, may lead to protests or demonstrations, which have the potential to turn violent. Avoid large gatherings and political events.
If you decide to travel to Solomon Islands:
Date Issued: Wed, 14 May 2025
Updated with changes to security information.
Do not travel to Somalia due to crime, terrorism, civil unrest, health, kidnapping, piracy, and lack of availability of routine consular services.
Country Summary
Due to security risks, U.S. government employees working in Somalia are prohibited from traveling outside the Mogadishu International Airport complex where the U.S. Embassy is located. The U.S. Embassy in Mogadishu maintains normal staffing.
Crime
Violent crime is common throughout Somalia, including kidnapping and murder. Illegal roadblocks are widespread.
Terrorism
Terrorists continue to plot kidnappings, bombings, and other attacks in Somalia. They may attack with little or no warning and target:
- Airports
- Seaports
- Government buildings
- Hotels and restaurants
- Shopping areas
- Public places that attract large crowds and tourists
- Government, military, and other convoys
Attack methods can include car bombs, suicide bombers, individual attackers, and rocket fire.
Some areas, like the Somaliland region, have seen less terrorist activity. However, violence and explosive attacks can happen anywhere in Somalia, at any time.
Civil Unrest
Protests and demonstrations occur throughout Somalia. They can sometimes turn violent.
- Check local media for breaking events. Be prepared to adjust your plans.
- Keep travel documents up to date and easily accessible.
- Have evacuation plans that do not rely on U.S. government assistance.
Health
Medical facilities in Somalia have limited capacity. They are often absent in rural areas. The health care system lacks sufficient pharmaceuticals, medical supplies, and medical professionals. Hospitals do not meet U.S. standards.
- Bring enough supply of over the counter and prescription medicines, along with copies of their prescriptions, including the generic name for the medicines.
Piracy
Pirates are active in the waters off the Horn of Africa, specifically off the coast of Puntland.
Kidnapping
Violent crime, including kidnapping, is common throughout Somalia. Illegal roadblocks are widespread.
Lack of availability of consular services
The U.S. government has extremely limited ability to help U.S. citizens in Somalia. There is no permanent consular officer in Somalia, not even the Somaliland region. If a traveler’s passport is lost, stolen, expires, or if they become destitute, the U.S. government may not be able to help.
Other issues
Some schools and other facilities act as “rehabilitation” centers. These facilities exist throughout Somalia with little or no licensing and oversight. Reports of physical abuse are common. People also report being held against their will in these facilities.
There are frequent reports of U.S. citizens who have their passports taken by family members, leaving them unable to leave Somalia. This often occurs when U.S. citizens travel to Somalia to visit family or attend an event. Some adult U.S. citizens cannot leave the international airport because they need explicit consent from their family.
Due to risks to civil aviation from extremist and military activity, the Federal Aviation Administration has issued a Special Federal Aviation Regulation that bans certain U.S. flights within or near Somalia. For more information, U.S. citizens should consult the Federal Aviation Administration’s Prohibitions, Restrictions, and Notices.
Read the Country Information Page for additional information on travel to Somalia.
If you decide to travel to Somalia:
- Review your personal security plan and visit our page on Travel to High-Risk Areas.
- Make a plan to exit Somalia rapidly if the situation gets worse. Identify multiple options for leaving Somalia and know the entry requirements for U.S. citizens in to neighboring countries.
- Avoid sailing near the coast of Somalia and review the Live Piracy Report published by the International Maritime Bureau.
- Draft a will and designate appropriate insurance beneficiaries and/or power of attorney.
- Discuss a plan with loved ones regarding care/custody of children, pets, property, belongings, non-liquid assets (collections, artwork, etc.), funeral wishes, etc.
- Share important documents, login information, and points of contact with loved ones so that they can manage your affairs if you are unable to return as planned to the United States. Find a suggested list of such documents here.
- Make your own personal security plan with your employer or host organization (if you are traveling on business) or consider consulting with a professional security organization.
- Develop a communication plan with family and/or your employer or host organization (if you are traveling on business), so that they can monitor your safety and location as you travel through high-risk areas. This plan should specify whom you would contact first, and how that person should share the information.
- Identify key sources of possible assistance for you and your family in case of emergency, such as your employer (if traveling on business), and local friends/family as well as friends/family outside Somalia.
- Appoint one family member to be the point of contact with hostage-takers and media.
- Appoint a family member to be the contact for the U.S. and host country government agencies, and members of Congress if you are taken hostage or detained.
- Discuss a proof of life protocol with your loved ones, so that if you are taken hostage, your loved ones can know specific questions (and answers) to ask the hostage-takers to be sure that you are alive (and to rule out a scam).
- Leave DNA samples with your medical provider in case it is necessary for your family to access them.
- Erase any sensitive photos, comments, or other materials from your social media pages, cameras, laptops, and other electronic devices. These could be considered controversial or provocative by local groups.
- Do not bring your sentimental belongings to Somalia.
- Enroll your trip in the State Department’s Smart Traveler Enrollment Program (STEP).
- Review the Country Security Report for Somalia.
- Prepare a backup plan for emergency situations. Review the Traveler’s Checklist.
- Update vaccinations to include all up-to-date standard vaccinations, plus Cholera, Hepatitis A, Hepatitis B, rabies, and a Polio booster.
- All visitors should take Malaria prophylaxis. Somalia is high risk for Malaria.
- Visit the CDC page for the latest Travel Health Information related to your travel.
Date Issued: Tue, 27 May 2025
Updated to reflect information on driving at night and addition of the terrorism risk indicator.
Exercise increased caution in South Africa due to crime, terrorism, civil unrest, and kidnapping.
Advisory summary: Violent crime is common and includes robbery, rape, carjacking and mugging. There are also “smash-and-grab” attacks on vehicles. Violent crime is more common in the downtown areas of big cities, especially after dark. Kidnapping is a threat in South Africa. Kidnappers target U.S. citizens and other foreign travelers to steal money. Captors often force victims to withdraw cash or give online account passwords before they are let go. Though rare, some kidnappings involve demanding ransom from families.
There is risk of terrorist violence, including terrorist attacks and other activity, in South Africa. Visit the U.S. Department of State’s country reports on terrorism to learn more.
Demonstrations, protests, and strikes occur frequently. They can:
- Start suddenly
- Interrupt traffic, transportation, and other services
- Turn violent
Due to the risks, U.S. government employees working in South Africa must obtain special authorization to travel to many informal settlements (townships) in and around Cape Town. U.S. mission staff must use fully armored vehicles when visiting and visiting hours are limited to 10:00 -15:00 weekdays only.
If you decide to travel to South Africa:
- Avoid walking alone, especially after dark.
- Avoid demonstrations and crowds.
- Do not display signs of wealth, such as expensive watches or jewelry.
- Drive with doors locked and windows closed.
- Follow local authority instructions.
- Always carry a copy of your U.S. passport and visa (if applicable). Keep original documents in a secure location.
- Avoid visiting informal settlements (townships) unless you are with someone familiar with the area.
- Avoid driving outside of metropolitan areas at night, due to road hazards such as animals, broken down vehicles, and the potential to become a victim of crime.
- Stay aware of your surroundings.
- Stay alert in tourist spots.
- Have evacuation plans that do not rely on U.S. government assistance.
- Keep travel documents up to date and easily accessible.
Read the country information page for additional information on travel to South Africa.
U.S. citizens should always exercise caution when traveling abroad. Use these general tips to stay safe:
Date Issued: Wed, 28 May 2025
Updated to reflect information on demonstrations and ongoing physician shortage.
Exercise normal precautions when traveling to the Republic of Korea (ROK or South Korea).
Advisory summary: Large-scale demonstrations related to the domestic political situation may occur with little notice, potentially disrupting transportation and other essential services.
Tensions on the Korean Peninsula remain high. North Korea continues to conduct missile launches and other military activities that may increase tensions. Travelers should monitor local developments and remain vigilant. The South Korean government conducts civil emergency drills throughout the year.
Read the country information page for additional information on travel to South Korea. Please note that consular services, including passport services, are not available at the U.S. Consulate in Busan; they are only available at the U.S. Embassy in Seoul.
If you decide to travel to South Korea:
Date Issued: Thu, 13 Nov 2025
There was no change to the advisory level. The “health” and “unrest” risk indicators were added. Advisory summary was updated.
Do not travel to South Sudan due to risk of unrest, crime, kidnapping, landmines, and health threats.
Advisory summary
The U.S. government has limited ability to provide emergency consular services to U.S. citizens in South Sudan.
- U.S. government personnel working in South Sudan are under a strict curfew.
- U.S. government personnel must use armored vehicles for nearly all movements.
- Official travel outside Juba is limited.
- Because of the serious crime threat in Juba, walking is restricted to a small area near the embassy during the day.
Unrest
Armed conflict is ongoing and includes fighting between various political and ethnic groups. Weapons are readily available to the population. In addition, cattle raids occur throughout the country, often leading to violence.
Journalists regularly report being harassed in South Sudan and many have been killed while covering the conflict. Reporting in South Sudan without the proper documentation from the South Sudanese Media Authority is illegal. Any journalistic work there is very dangerous.
Crime
Violent crime is common throughout South Sudan, including Juba. This includes carjackings, shootings, ambushes, assaults, robberies, and kidnappings.
Foreign nationals have been the victims of rape, sexual assault, armed robberies, and other violent crimes.
Kidnapping
Criminal groups have kidnapped and threatened to kill or hurt people in order to force a third party, like a government, to act or abstain from doing something as a condition of release.
Kidnapping for ransom happens occasionally in South Sudan. Criminal groups most frequently target local citizens.
Landmines
Landmines are sparsely located throughout the country. While most locations are marked, unmarked unexploded ordinance remains a threat and causes multiple casualties each year.
Health
Medical services in South Sudan are extremely limited. Adequate medical treatment, as well as access to routine and emergency procedures, is often unavailable, and even minor health issues could require medical evacuation. All medical services, including medical evacuation, are at your expense. If you purchase additional medical insurance, be sure to keep records of all medical services paid for and provided.
For U.S. citizens in South Sudan:
- Do not travel to South Sudan for any reason.
- Have a plan to leave in an emergency that does not depend on U.S. government help. Review our information on crisis and evacuations.
- Review our information on travel to high-risk areas, crime, and for victims of crime.
- Avoid locations where landmines are known to exist. Be alert to signs that mark unexploded landmines. Be aware that locations of landmines and unexploded ordnance are often not known, marked, or easy to recognize.
- Monitor local media for breaking news. Be prepared to adjust your plans.
- Stay aware of your surroundings.
- Draft a will. Designate appropriate insurance beneficiaries or draft a power of attorney.
- Develop a communication plan with your family, your employer, or your host organization. List how and when you will confirm you are safe (text or call). Specify how often you will do this.
- Establish a proof of life protocol with your loved ones. If you are taken hostage, your loved ones will know specific questions (and answers) to ask the hostage-takers to confirm you are being held captive and alive.
- Leave DNA samples with your medical provider in case it is necessary for your family to access them for identification purposes.
- Make sure your insurance includes specific coverage for medical evacuation from South Sudan.
- Enroll in the Smart Traveler Enrollment Program (STEP) to get important updates and alerts from the U.S. government. Enrolling helps the U.S. government contact you or your emergency contact in an emergency.
- Review the Country Security Report for South Sudan.
- Visit the U.S. Centers for Disease Control and Prevention website for the latest Travel Health Information for South Sudan.
- Whether you are a first-time or frequent traveler, use the International Travel Checklist.
- We highly recommend that you buy travel insurance before you travel. Check with your travel insurance provider about evacuation assistance, medical insurance, and trip cancelation coverage.
Date Issued: Mon, 12 May 2025
Reissued after periodic review with minor edits.
Exercise increased caution in Spain due to terrorism and civil unrest.
Country Summary: Terrorist groups continue plotting possible attacks in Spain. Terrorists may attack with little or no warning and target:
- Tourist locations
- Transportation centers (airports/train stations)
- Markets and shopping malls
- Local government facilities
- Hotels, clubs, and restaurants
- Places of worship and educational institutions
- Parks
- Major sporting and cultural events
Demonstrations are common. They may take place in response to political or economic issues, on politically significant holidays, and during international events.
If you decide to travel to Spain:
- Avoid demonstrations and crowds.
- Be aware of your surroundings.
- Follow the instructions of local authorities.
- Check local media for breaking events. Be prepared to adjust your plans.
U.S. citizens should always exercise caution when traveling abroad. Use these general tips to stay safe:
Date Issued: Tue, 14 Oct 2025
Exercise increased caution in Sri Lanka due to civil unrest, terrorism, and landmines. Read the entire Travel Advisory.
Demonstrations
Protests over the economic and political situation in Sri Lanka can happen at any time.
- Police have used water cannons and tear gas to disperse protesters.
- Avoid all gatherings, even peaceful ones.
- Protests could turn violent with little or no warning.
Terrorism
There is risk of terrorist violence, including terrorist attacks and other activity in Sri Lanka. Visit the U.S. Department of State’s country reports on terrorism to learn more.
Terrorist attacks have occurred in Sri Lanka, with little or no warning.
They may target:
- Tourist locations
- Transportation hubs
- Markets and shopping malls
- Government buildings
- Hotels, clubs, and restaurants
- Places of worship
- Parks
- Major sporting and cultural events
- Schools and hospitals
- Airports
- Other public areas
The U.S. government has limited ability to provide emergency services to U.S. citizens in remote areas.
Land mines
Approximately 23 square kilometers of Sri Lanka have land mines left from its civil war. Most land mines have been cleared, but some areas in northern and eastern Sri Lanka are still dangerous. The highest concentration is in the northern districts of the Northern Province. This territory has dense forests and rough terrain. Warning signs with the international land mine symbol mark the areas of greatest risk. The symbol shows a skull and crossbones in a red, upside-down triangle. White markers indicate cleared land.
Date Issued: Wed, 15 Oct 2025
There was no change to the advisory level. The “health” risk indicator was added. Advisory summary was updated.
Advisory summary
The U.S. Embassy in Khartoum suspended its operations in April 2023 due to the outbreak of armed conflict in Sudan. The U.S. government cannot provide routine or emergency consular services to U.S. citizens in Sudan due to the current security situation.
To report an emergency regarding a U.S. citizen in Sudan, contact U.S. Embassy Cairo at +20-2-2797-3300. Or contact the Department of State at +1-888-407-4747 from the United States and Canada or +1-202-501-4444 from elsewhere in the world.
Unrest – Armed Conflict
Armed conflict continues in Sudan. This includes heavy fighting among the Sudanese Armed Forces, the paramilitary Rapid Support Forces, and various armed militias. The situation is violent, volatile, and extremely unpredictable, particularly in the Kordofan and Darfur regions, as well as in the capital region, including Khartoum and Omdurman.
Khartoum International Airport is currently closed to commercial traffic, while commercial service to the Port Sudan International Airport has been limited at times due to drone strikes. Electrical and communication disruptions can occur at any time. This includes internet and cell phone service interruptions.
Crime
Crime, including kidnapping, assault, armed robbery, home invasion, looting, and carjacking, is a common threat throughout the country. Checkpoints might occur at any time, some of which may be legitimate security checkpoints, others may intend to loot, others may present a risk to particular populations.
Terrorism
Members of known terrorist groups and individuals sympathetic to these groups can attack with little or no warning. They may target foreign and local government facilities as well as areas frequented by travelers.
Landmines
Landmines are a threat, as much of Sudan is an active war zone. There are widespread reports of unexploded ordnance posing a threat in Khartoum and elsewhere in the country, even after fighting has ended in those areas.
Health
Medical services in Sudan are extremely limited. Adequate medical treatment for routine and emergency procedures is often not available. Even minor health issues could require medical evacuation at the traveler’s expense. Make sure you have medical or travel insurance that includes medical evacuation. Review our information on Travel Insurance. Check with your doctor about required vaccines and shots for high-risk exposure before you go to Sudan. Visit the Centers for Disease Control and Prevention (CDC) website for the latest Travel Health Information for Sudan.
For U.S. citizens in Sudan:
- The Department of State urges U.S. citizens to leave Sudan.
- Travel within Sudan is conducted at your own risk. The U.S. government cannot guarantee your safety traveling to airports, borders, or during any onward travel. You should consider your personal security situation before traveling anywhere in Sudan. Only attempt to depart Sudan or travel within Sudan if you believe it is safe for you to do so.
- Exercise extreme caution in all parts of the country, including Khartoum.
- Have a plan to leave in an emergency that does not depend on U.S. government help. Review our information on crisis and evacuations.
- Review our information on crime, including for victims of crime.
- There is risk of terrorist violence, including terrorist attacks and other activity, in Sudan. Visit the U.S. Department of State’s Country Reports on Terrorism to learn more.
- Review our information on terrorism and travel to high-risk areas.
- Landmines and unexploded ordnance exist throughout Sudan. The locations of landmines and unexploded ordnance are often not known, marked, or easy to recognize.
- Monitor local media for breaking news. Be prepared to adjust your plans.
- Stay aware of your surroundings.
- Draft a will. Designate appropriate insurance beneficiaries or draft a power of attorney.
- Develop a communication plan with your family, your employer, or your host organization. List how and when you will confirm you are safe (text or call). Specify how often you will do this.
- Establish a proof of life protocol with your loved ones. If you are taken hostage, your loved ones will know specific questions (and answers) to ask the hostage-takers to confirm you are being held captive and alive.
- Make sure your insurance includes specific coverage for medical evacuation from Sudan.
- Enroll in the Smart Traveler Enrollment Program (STEP) to get important updates and alerts from the U.S. government. Enrolling helps the U.S. government contact you or your emergency contact in an emergency.
- Review the Country Security Report for Sudan.
- Visit the U.S. Centers for Disease Control and Prevention website for the latest Travel Health Information for Sudan.
- We highly recommend that you buy travel insurance before you travel. Check with your travel insurance provider about evacuation assistance, medical insurance, and trip cancelation coverage.
Date Issued: Fri, 13 Dec 2024
Reissued with obsolete COVID-19 page links removed.
Exercise normal precautions in Suriname.
Read the country information page for additional information on travel to Suriname.
If you decide to travel to Suriname:
Date Issued: Wed, 24 Jul 2024
Reissued after periodic review without changes
Exercise increased caution in Sweden due to terrorism.
Country Summary: Terrorist groups continue plotting possible attacks in Sweden. Terrorists may attack with little or no warning, targeting tourist locations, transportation hubs, markets/shopping malls, local government facilities, hotels, clubs, restaurants, places of worship, parks, major sporting and cultural events, educational institutions, airports, and other public areas.
Read the country information page for additional information on travel to Sweden.
If you decide to travel to Sweden:
- Be aware of your surroundings when traveling to tourist locations and crowded public venues.
- Follow the instructions of local authorities.
- Monitor local media for breaking events and adjust your plans based on new information.
- Enroll in the Smart Traveler Enrollment Program (STEP) to receive Alerts and make it easier to locate you in an emergency.
- Follow the Department of State on Facebook and Twitter.
- Review the Country Security Report for Sweden.
- Visit the CDC page for the latest Travel Health Information related to your travel.
- Prepare a contingency plan for emergency situations. Review the Traveler’s Checklist.
Date Issued: Tue, 20 May 2025
Reissued after periodic review with minor edits.
Exercise normal precautions in Switzerland.
Read the country information page for additional information on travel to Switzerland.
If you decide to travel to Switzerland:
Date Issued: Thu, 11 Dec 2025
There were no changes to the advisory level or risk indicators. Advisory summary was updated.
Do not travel to Syria for any reason due to the risk of terrorism, civil unrest, kidnapping, hostage taking, crime, and armed conflict.
Advisory Summary
Do not travel to Syria for any reason.
The U.S. government suspended U.S. Embassy operations in 2012. The Czech Republic is the protecting power for the United States in Syria. The U.S. government cannot offer emergency or routine consular services to U.S. citizens in Syria due to the safety risks.
Armed conflict
Syria has experienced active armed conflict since 2011. No part of Syria is safe from violence. Hostage taking, terrorism, unexploded ordnance, and aerial bombardment pose significant risk of death or serious injury. The destruction of infrastructure, housing, medical facilities, schools, and power and water utilities has also increased hardships in Syria.
The U.S. government strongly warns private U.S. citizens against traveling to Syria to engage in armed conflict. The U.S. government does not support this activity. U.S. citizens who undertake such activity face extreme personal risks, including being taken hostage, injury, or death.
Terrorism
There is risk of terrorist violence in Syria. Visit the U.S. Department of State’s country reports on terrorism to learn more.
- Bombings, improvised explosive devices (IEDs), and assassinations remain a threat in parts of Syria.
- Providing material support or resources to designated foreign terrorist organizations, including ISIS and al-Qa’ida (AQ) affiliates, is a crime under U.S. law that can result in prison time and large fines.
Hostage taking
Hostage taking of U.S. citizens and other foreign nationals continues to be a risk throughout the country.
- Detainees may lack access to fair judicial process or medical attention.
- Detention centers can be harsh and unsanitary.
- You can be detained if you do not get your entry visa directly from the Syrian government.
Air travel
The Federal Aviation Administration (FAA) has issued a Notice to Airmen (NOTAM) and a Special Federal Aviation Regulation (SFAR). This is due to risks to civil aviation operating within or nearby Syria.
Maritime travel
The U.S. Coast Guard determined Syrian ports do not have effective anti-terrorism measures. Vessels that arrive in U.S. ports from Syrian ports must meet additional U.S. Coast Guard conditions of entry as described in the current Port Security Advisory, International Port Security Program – Port Security Advisory.
Mariners and passengers traveling through Syrian ports should be careful and use strong security measures.
Czech Protecting Power in Damascus
The U.S. government suspended U.S. Embassy operations in 2012. The Czech Republic serves as the protecting power for the United States in Syria.
The Czech Protecting Power provides only emergency services to U.S. citizens, including:
- Acceptance of applications for emergency passports
- Consular Report of Death Abroad (CRODA) applications
- Emergency financial assistance
- Assistance to detained U.S. nationals
- Welfare and whereabouts checks for U.S. citizens when security conditions permit
For routine consular services, including applying for a full-validity U.S. passport or Consular Report of Birth Abroad (CRBA), and notarial services, U.S. citizens must visit a U.S. embassy or consulate outside Syria or return to the United States.
For U.S. citizens in Syria:
- Enroll in the Smart Traveler Enrollment Program (STEP) to get important updates and alerts,
- Review our information on Terrorism and Travel to High Risk Areas.
- There is risk of terrorist violence, including terrorist attacks and other activity in Syria. Visit the U.S. Department of State’s country reports on terrorism to learn more.
- Review our information on U.S. Citizens Missing Abroad, for Crime Abroad, and for Victims of Crime.
- Have a plan to depart in an emergency that does not depend on U.S. government help. Review our information on Crisis and Evacuations.
- Prepare a will and designate appropriate insurance beneficiaries or power of attorney.
- Keep travel documents up to date and easily accessible.
- Familiarize yourself with and respect local laws and customs. Foreign travelers may face increased risk of detention and harassment.
- Establish a proof of life protocol with your loved ones. If you are taken hostage, your loved ones will know specific questions (and answers) to ask the hostage-takers to confirm that you are being held captive and alive.
- Leave DNA samples with your medical provider in case it is necessary for your loved ones to access them for identification purposes.
- Share important documents, login information, and points of contact with loved ones. This helps them manage your affairs if you cannot return to the United States.
- Check local media for breaking news. Be prepared to adjust your plans.
- Develop a communication plan with family, your employer, or host organization. This helps them monitor your safety and location as you travel through high-risk areas. Specify how you’ll confirm you’re safe (text, calls, etc.), how often, and who you’ll contact first to share the information. Avoid demonstrations and crowds.
- Visit the Centers for Disease Control and Prevention (CDC) website for the latest Travel Health Information for Syria.
- Be aware of possible online dating scams, either for potential financial theft or physical harm.
- Whether you’re a first time or frequent traveler, use the International Travel Checklist.
- We highly recommend that you buy insurance before you travel. Check with your travel insurance provider about evacuation assistance, medical insurance, and trip cancellation coverage.
Date Issued: Tue, 25 Nov 2025
There were no changes to the advisory level or risk indicators. Advisory summary was updated.
Exercise normal precautions in Taiwan.
There is a risk of natural disasters in Taiwan, including earthquakes, tsunamis, typhoons, flooding, and extreme heat. Please review the Destination Information Page for more information.
If you decide to travel to Taiwan:
Date Issued: Fri, 16 May 2025
Reissued after periodic review with updates regarding the resumption of cross-border movement between the Kyrgyz Republic and Tajikistan.
Exercise increased caution in Tajikistan due to the risk of terrorism, unexploded landmines, occasional violence near the border with the Kyrgyz Republic, and limited ability to assist U.S.-Tajik dual nationals. Some areas have increased risk. Read the entire Travel Advisory.
Reconsider travel to:
- Tajikistan’s border with Afghanistan due to terrorism.
- Gorno-Badakhshan Autonomous Oblast (GBAO) due to the potential for armed conflict.
Country Summary: Terrorist organizations are known to have a presence in the region and have targeted foreigners and local authorities in the past.
Terrorists may attack with little or no warning. They target:
- Tourist locations
- Transportation hubs
- Markets and shopping malls
- Restaurants
- Places of worship
- Schools
- Government facilities.
Visit the U.S. Department of State Country Reports on Terrorism to learn more.
Unexploded landmines and cluster munitions are a hazard along the Afghan-Tajik and Uzbek-Tajik borders, as well as in the Vakhsh and Rasht valleys. Pay attention to land mine warning signs. Do not venture off the road into areas marked with red and white plastic tape. Avoid roadside ditches, shoulders, and unmarked trails in these regions. Never touch anything resembling unexploded munitions.
Be cautious when traveling near, along, and through the Tajikistan-Kyrgyz Republic land border as there have been several instances of armed skirmishes between Tajik and Kyrgyz border guards over the past five years, particularly in the Isfara area and the Vorukh enclave. In March 2025, the March 13, 2025, signing and subsequent ratification of bilateral agreements between the Kyrgyz Republic and Tajikistan have facilitated the resumption of cross-border movement at the Guliston–Kyzyl-Bel and Madaniyat–Kayragach border crossing points.
Tajikistan does not recognize dual nationality with the United States. Dual U.S.-Tajik citizens and U.S. citizens of Tajik descent may be subject to additional scrutiny and harassment from local authorities and may be denied access to U.S. consular officials while in detention.
Read the country information page for additional information on travel to Tajikistan.
If you decide to travel to Tajikistan:
- Enter Tajikistan on your U.S. passport and keep it with you.
- Have a plan to depart Tajikistan which does not rely on U.S. government assistance.
- Keep a low profile.
- Be aware of your surroundings.
- Monitor local media for breaking events and be prepared to adjust your plans.
- Do not touch unknown metal objects and avoid traveling off well-used roads, tracks, and paths due to risk of unexploded ordnance.
- If you are arrested or detained, ask police or prison officials to notify the U.S. Embassy immediately.
- Enroll in the Smart Traveler Enrollment Program (STEP) to receive messages and Alerts from the U.S. Embassy and make it easier to locate you in an emergency.
- Review the Country Security Report for Tajikistan.
- Prepare a contingency plan for emergency situations. Review the Traveler’s Checklist.
- Visit the CDC page for the latest Travel Health Information related to your travel and return to the United States.
- We highly recommend that you buy insurance before you travel. Check with your travel insurance provider about evacuation assistance, medical insurance, and trip cancellation coverage.
Border Areas with Afghanistan – Level 3: Reconsider Travel
Reconsider travel in proximity of Tajikistan’s border with Afghanistan due to terrorism. The current political situation in Afghanistan creates a challenging and unpredictable security environment in the border areas. Travel in the mountainous region along the Afghan border can be dangerous due to the proximity of militant groups across the border. Due to the risks, U.S. government employees working in Tajikistan must obtain special authorization to travel to border areas with Afghanistan. U.S. citizens should remain alert and avoid activities that develop predictable patterns of movement. If documenting travel on social media, ensure your privacy settings do not reveal your exact location.
Visit our website for Travel to High-Risk Areas.
Gorno-Badakhshan Autonomous Oblast (GBAO)– Level 3: Reconsider Travel
The challenging and unpredictable environment in northern Afghanistan has the potential to create insecurity in neighboring Tajikistan’s GBAO region. GBAO is a restricted region for non-Tajik citizens, requiring travel permits from Tajik authorities. Violent clashes with security forces have erupted in GBAO in recent years, and the government of Tajikistan can suspend travel permits for non-Tajik citizens on short notice. Due to the risks, U.S. government employees working in Tajikistan must obtain special authorization to travel to GBAO.
Visit our website for information for Travel to High-Risk Areas.
Date Issued: Fri, 31 Oct 2025
The advisory level increased from Level 2 to 3. The “unrest” risk indicator was added.
Reconsider travel to Tanzania due to unrest, crime, terrorism, and targeting of gay and lesbian individuals. Some areas have increased risk. Read the entire Travel Advisory.
Advisory summary
Unrest
Demonstrations often take place in response to political or economic issues. They may also occur on holidays or during large events.
- Demonstrations can be unpredictable.
- The Tanzanian government increases security presence around protests. This includes stationary checkpoints and roadblocks.
- The Tanzanian government limits or does not authorize large gatherings.
Crime
Violent crime is common. It includes assault, sexual assault, robberies, mugging, and carjacking. Local police have limited resources to respond effectively to serious crime.
Terrorism
There is risk of terrorist violence, including terrorist attacks and other activity in Tanzania. Visit the U.S. Department of State’s country reports on terrorism to learn more.
The risk of terrorist violence is most common in the Mtwara Region.
Targeting of gay and lesbian individuals
Members of the gay and lesbian community have been arrested, targeted, and harassed. People who identify as gay or lesbian may experience a higher likelihood of being targeted by police. People detained under suspicion of same-sex sexual conduct may face invasive physical exams.
If you decide to travel to Tanzania:
- Have a plan to leave in an emergency that does not depend on U.S. government help. Review our information on Crisis and Evacuations.
- Monitor local media for breaking news. Be prepared to adjust your plans.
- Keep a low profile.
- Always carry a copy of your U.S. passport and visa. Keep original documents in a safe location.
- Stay aware of your surroundings.
- Do not leave your food or drink unattended.
- Stay alert in tourist spots.
- Avoid public displays of affection particularly between same-sex couples.
- Enroll in the Smart Traveler Enrollment Program (STEP) to get important updates and alerts from the U.S. embassy or consulate. Enrolling helps the U.S. embassy or consulate contact you or your emergency contact in an emergency.
- Review the Country Security Report for Tanzania.
- Review our information on Terrorism, Travel to High-Risk Areas, Crime Abroad, and for Victims of Crime.
- Prepare a backup plan for emergency situations. Review the Traveler’s Checklist.
- Visit the CDC page for the latest Travel Health Information related to your travel.
Date Issued: Fri, 25 Jul 2025
The advisory level was increased to Level 2. An area of increased risk was added. The advisory summary was updated.
Exercise increased caution in Thailand due to risk of unrest. Some areas have increased risk. Read the entire Travel Advisory.
Do Not Travel to:
- Areas along the Cambodian and Thai border due to armed conflict.
Advisory summary:
Exercise increased caution due to civil unrest associated with ongoing insurgent activities in the Yala, Pattani, and Narathiwat provinces.
Periodic violence between Thai security services and armed insurgents has been known to occur in Thailand’s three southernmost provinces of Yala, Pattani, and Narathiwat. Seventeen districts in these provinces remain under a declared state of emergency due to ongoing violent conflict. There is a collateral risk of violence for U.S. citizens in Thailand’s southernmost provinces due to low intensity conflict.
The U.S. government has limited ability to provide emergency services to U.S. citizens in these provinces as U.S government employees must obtain special authorization to travel to these provinces.
Level 4 – Do Not Travel
Thailand – Cambodia Border:
Do not travel to areas within 50km of the Thai-Cambodian border due to ongoing fighting between Thai and Cambodian military forces.
There are reports of fighting, including rocket and artillery fire, between Cambodian and Thai forces along the border. Armed conflict has led to civilian casualties, and the Thai government has ordered the evacuation of certain areas. There is a collateral risk of violence, and U.S. citizens are advised to avoid all but essential travel to within 50km of these border areas until further notice. The U.S. government has limited ability to provide emergency services to U.S. citizens in these provinces due to the ongoing risk of armed conflict.
Read the destination information page for additional information on travel to Thailand.
If you decide to travel to Thailand:
- Have evacuation plans that do not rely on U.S. government assistance.
- Enroll in the Smart Traveler Enrollment Program (STEP) to get important updates and alerts from the U.S. embassy or consulate. Enrolling helps the U.S. embassy or consulate contact you or your emergency contact in an emergency.
- Review the Country Security Report for Thailand.
- Prepare a contingency plan for emergency situations. Review the Traveler’s Checklist.
- Visit the CDC page for the latest Travel Health Information related to your travel.
- We highly recommend that you buy insurance before you travel. Check with your travel insurance provider about evacuation assistance, medical insurance, and trip cancellation coverage..
Date Issued: Mon, 31 Mar 2025
Updated to reflect crime, swimming-related risks, and information on traveling with firearms and ammunition.
Exercise increased caution due to crime.
Country Summary: Violent crime—like armed robberies, burglaries, and sexual assaults—can occur anywhere in The Bahamas.
Most crime occurs in Nassau and Freeport on New Providence and Grand Bahama islands. Stay alert in the “Over the Hill” area in Nassau, south of Shirley Street, where gangs have killed residents.
Stay alert in vacation rental properties, especially where private security is not present.
Jet skis and boating
- Boating is not well regulated. Injuries and deaths have occurred.
- Sexual assaults by jet ski operators have also been reported.
- Due to the risks, U.S. government employees are prohibited from using jet skis and personal watercraft rented from independent operators on New Providence and Paradise islands.
- Watercraft may not be safe, and some operators are not licensed or insured.
- Watercraft operators sometimes ignore weather forecasts. Always follow local weather and marine alerts.
Beach safety
- Never swim alone and beware of jet skis or other watercraft operating close to shore.
- Sexual assaults have occurred on and near downtown Nassau beaches. Be aware of your surroundings and stay alert in public restrooms.
- Be aware of your own fitness and swimming capabilities.
- If you are new to snorkeling, understand the risks. Swimmers and snorkelers have died after overestimating their physical fitness or health.
- Stay alert for sharks. Shark attacks have led to serious injuries and death.
- Be aware of weather and water conditions and follow local warnings.
Weapons and ammunition
Firearms and ammunition are illegal—including small quantities brought by mistake in carry-on bags or luggage. Police strictly enforce these laws—even at the airport when travelers are leaving.
Travelers with firearms or ammunition can face arrest, jail time, and fines.
Authorities have detained U.S. citizens for several days or more after finding firearms or ammunition, preventing them from leaving.
Read the country information page for additional information on travel to The Bahamas.
If you decide to travel to The Bahamas:
- Do not answer your door at your hotel or residence unless you know who it is.
- Lock doors and windows and use other security features, especially on balcony doors.
- Do not physically resist any robbery attempt.
- Check your luggage and hand baggage carefully for bullets or firearms before leaving the United States. Do not bring these items to The Bahamas.
- Enroll in the Smart Traveler Enrollment Program (STEP) to receive messages and Alerts from the U.S. Embassy and make it easier to locate you in an emergency Prepare a plan for emergency situations.
- Review the Traveler’s Checklist.
- Visit the CDC page for the latest Travel Health Information related to your travel and return to the United States.
- We highly recommend that you buy insurance before you travel. Check with your travel insurance provider about evacuation assistance, medical insurance, and trip cancellation coverage.
Date Issued: Fri, 16 Jan 2026
Exercise increased caution in The Gambia due to crime, unrest, and inadequate health infrastructure.
Crime
Petty street crime and home burglaries happen often in The Gambia. This is most common in the Banjul area and tourist spots.
Do not display cash and valuable personal property. Avoid walking alone, including on beaches, in tourist areas, and after dark.
Unrest
A separatist rebel group operates in the Casamance region of southern Senegal. There has been sporadic fighting along The Gambia’s southern border in the recent past. Stay on main roads and do not travel at night if travelling near or across the southern border.
Health
The Gambia’s health infrastructure is inadequate. Health services, hygiene, and quality control do not meet U.S. standards of care. Pharmacies are not well regulated. Locally available medications may be unsafe.
Date Issued: Fri, 21 Mar 2025
Reissued after periodic review with minor edits. Exercise increased caution in Timor-Leste due to crime and civil unrest.
Country Summary: Timor-Leste has seen isolated instances of police responding to protests with force and the use of tear gas.
Stone throwing attacks on vehicles can occur during gang conflicts and periods of unrest. Sex-based violence is high in Timor-Leste and sexual harassment is fairly common.
Read the country information page for additional information on travel to Timor-Leste.
If you decide to travel to Timor-Leste:
- Keep a low profile.
- Be aware of your surroundings.
- Use caution when walking or driving at night.
- Avoid demonstrations or crowds.
- Keep travel documents up to date and easily accessible.
- Obtain comprehensive medical insurance that includes medical evacuation.
- Enroll in the Smart Traveler Enrollment Program (STEP) to receive Alerts and make it easier to locate you in an emergency.
- Review the Country Security Report for Timor-Leste.
- Prepare a contingency plan for emergency situations. Review the Traveler’s Checklist.
- We highly recommend you buy insurance before you travel. Check with your travel insurance provider about evacuation assistance, medical insurance, and trip cancellation coverage.
Date Issued: Thu, 07 Nov 2024
Updated to reflect Travel Advisory Level Change from 1 to a 2 due to Terrorism, Crime, Civil Unrest, and Kidnapping.
Exercise Increased Caution in Togo. Some areas have increased risk. Read the entire Travel Advisory.
Country Summary: Criminals and terrorist groups are active in Togo, particularly in areas bordering Burkina Faso and Northern Benin. Attacks in these areas can occur with little or no warning, and could target shops, markets, hotels, places of worship, restaurants, bars, schools, government buildings, transportation hubs, and other places where crowds gather. Violent attacks are far more likely in the northern areas of Togo than in the southern and coastal areas.
Crimes such as robbery and assault occur in Togo. These crimes often happen at night and in isolated locations. Crime occurs more frequently in urban areas, near the beach, and in crowded markets.
Small protests have occurred in urban areas. Police have used tear gas to disperse protests that caused traffic disruptions in city centers and along National Route 1, and they have arrested protesters. Security forces have used force to disperse crowds and authorities have cut internet and cell services.
Do Not Travel to:
- Northern border region adjacent to Burkina Faso due to potential for terrorism and kidnapping.
- Areas north of Kande due to potential for terrorism.
Read the country information page for additional information about travel to Togo.
If you decide to travel to Togo:
- Keep a low profile.
- Be aware of your surroundings.
- Stay alert in locations frequented by Westerners.
- Be extra vigilant when visiting banks or ATMs.
- Do not physically resist any robbery attempt.
- Do not display signs of wealth, such as expensive watches or jewelry.
- Avoid demonstrations and crowds.
- Monitor local media for breaking events and be prepared to adjust your plans.
- Keep travel documents up to date and easily accessible.
- Have evacuation plans that do not rely on U.S. government assistance.
- Enroll in the Smart Traveler Enrollment Program (STEP) to receive Alerts and make it easier to locate you in an emergency.
- Follow the Department of State on Facebook and Twitter.
- Follow the U.S. Embassy in Togo on Facebook and Twitter.
- Review the Country Security Report for Togo.
- Prepare a contingency plan for emergency situations. Review the Traveler’s Checklist.
- Visit the CDC page for the latest Travel Health Information related to your travel.
Northern Border Region – Level 4: Do Not Travel
Extremist groups have carried out attacks, including kidnappings, in the northern border region of Togo, the adjacent areas of Burkina Faso, and Benin. Attacks may occur with little or no warning. The current travel policy for embassy personnel prohibits travel north of the town of Dapaong and Highway N24 or Highway N28, along with the district of Kpendjal and Kpendjal-Ouest without special authorization. Embassy personnel may not remain overnight in areas north of Mango. The U.S. government has limited ability to provide emergency services to U.S. citizens in these areas. Due to security incidents, the Savanes region is under a Government of Togo state of emergency, and non-Togolese travelers must obtain special authorization to travel in the Savanes.
North of Kande – Level 4: Do Not Travel
Extremist groups have carried out attacks in nearby areas of Benin. Attacks may occur with little or no warning.
Date Issued: Mon, 02 Dec 2024
Reissued after periodic review without changes.
Exercise normal precautions in Tonga.
Read the Country Information page for additional information on travel to Tonga.
If you decide to travel to Tonga:
Date Issued: Wed, 07 May 2025
Updated to reflect the end of the State of Emergency on April 13, 2025.
Reconsider travel to Trinidad and Tobago due to serious risks from crime. There are also heightened risks of terrorism and kidnapping.
Country Summary: Violent crime is common in Trinidad and Tobago. It includes:
- Murder
- Robbery
- Assault
- Sexual assault
- Home invasion
- Kidnapping
Gang activity, such as narcotics trafficking, is common. A significant portion of violent crime is gang-related.
Due to the risks from crime, U.S. government employees working in Trinidad and Tobago are prohibited from travelling to the following areas in Port of Spain:
- At any time:
- Laventille,
- The southern end of Charlotte Street between Oxford Street and Park Street (past the General Hospital)
- Piccadilly Street
- Besson Street
- Beetham, Sea Lots, Cocorite, and the interior of Queens’ Park Savannah.
- At night:
- Downtown Port of Spain
- Fort George overlook, and all beaches.
Foreigners and a U.S. lawful permanent resident have been recent victims of kidnapping.
There is risk of terrorist violence, including terrorist attacks and other activity in Trinidad and Tobago. Visit the U.S. Department of State’s Country Reports on Terrorism to learn more.
Terrorists may attack with little or no warning. They may target:
- Tourist locations
- Transportation centers (airports)
- Markets and shopping malls
- Local government buildings
- Hotels and clubs
- Restaurants
- Places of worship
- Parks
- Major sporting and cultural events
- Schools
Read the country information page for additional information on travel to Trinidad and Tobago.
If you decide to travel to Trinidad and Tobago:
- Use caution when walking or driving at night. Avoid poorly lit or remote areas.
- Be aware of possible online dating scams, either for potential financial theft or physical harm.
- Stay aware of your surroundings.
- Do not display signs of wealth, like cash, expensive watches, or jewelry.
- Stay alert when visiting banks and ATMs.
- Do not physically resist any robbery attempt unless forced into a vehicle or remote area.
- Check local media for breaking events. Be prepared to adjust your plans.
- Visit our website for Travel to High-Risk Areas.
- Develop a communication plan with family or your employer or host organization (if you are traveling on business). This helps them monitor your safety and location as you travel through high-risk areas. Specify how you’ll confirm you’re safe (text, calls, etc.), how often, and whom you’ll contact first to share the information.
- Enroll in the Smart Traveler Enrollment Program (STEP) to receive messages and Alerts from the U.S. Embassy. It makes it easier to locate you in an emergency.
- Review the Country Security Report for Trinidad and Tobago.
- Prepare a plan for emergency situations. Review the Traveler’s Checklist.
- Visit the CDC page for the latest Travel Health Information related to your travel and return to the United States.
- We highly recommend that you buy insurance before you travel. Check with your travel insurance provider about evacuation assistance, medical insurance, and trip cancelation coverage.
Date Issued: Wed, 23 Oct 2024
Reissued to update information to high-risk areas, country summary, and the “If you decide to travel” section, and Level 4 “Do Not Travel” areas.
Exercise increased caution in Tunisia due to terrorism. Some areas have increased risk. Read the entire Travel Advisory.
Do not travel to:
- Within 16 km of the Algerian border due to terrorism, except for the cities of Tabarka and Ain Draham.
- Within 16 km of the border with Libya due to terrorism.
- The Mount Chaambi National Park, Mount Salloum, Mount Sammamma, and Mount Mghila in Kasserine governorate due to terrorism.
- The Mount Orbata area in the Gafsa governorate due to terrorism.
- The desert south of Remada due to the military zone.
Country Summary: Terrorist groups continue plotting possible attacks in Tunisia. Terrorists may attack with little or no warning, targeting tourist locations, transportation hubs, museums, resorts, hotels, festivals, nightclubs, restaurants, religious sites, markets/shopping malls, government facilities and security forces. A country-wide state of emergency, which grants security forces more authority to maintain civil order and enables the government to focus on combating terrorism, is in effect.
The U.S. government has limited ability to provide emergency services to U.S. citizens in some areas of Tunisia.
Read the country information page for additional information on travel to Tunisia.
If you decide to travel to Tunisia:
- Exercise caution when using public transportation, due to safety and security concerns.
- Avoid demonstrations and crowds.
- Monitor local media for breaking events and be prepared to adjust your plans.
- Avoid staying overnight outside of the main cities and tourist locations.
- Obtain comprehensive medical insurance that includes medical evacuation coverage valid for Tunisia.
- When entering or transiting through Tunisia, do not bring in Tunisian currency in any amount and avoid bringing in any foreign currency, including dollars, over TND 10,000 (about $3,000 USD). Upon departure, including transit through Tunisia, travelers leaving Tunisia must declare any currency amounts above TND 5,000 (about $1,600 USD) if they wish to export or depart with that amount.
- Enroll in the Smart Traveler Enrollment Program (STEP) to receive Alerts and make it easier to locate you in an emergency.
- Follow U.S. Embassy Tunis on Facebook, Instagram, Twitter/X, and YouTube, and the Department of State’s Consular Affairs/Travel.gov on Facebook, Instagram, and Twitter/X.
- Review the Country Security Report for Tunisia.
- Visit the CDC page for the latest Travel Health Information related to your travel.
- Prepare a contingency plan for emergency situations. Review the Traveler’s Checklist.
Border with Algeria – Level 4: Do Not Travel
Do not travel within 16 km of the Algerian border due to terrorism, except for the cities of Tabarka and Ain Draham.
Visit our website for Travel to High-Risk Areas.
Border with Libya – Level 4: Do Not Travel
Developments in Libya continue to affect the security situation along the Tunisian-Libyan border in areas such as Ras Jedir and Dehiba along with the cities of Ben Guerdan and Medenine. The border with Libya is frequently closed to all traffic with short notice for extended periods. The Department of State advises U.S. citizens not to travel to Libya.
Visit our webpage for Travel to High-Risk Areas.
The Mount Chaambi National Park, Mount Salloum, Mount Sammamma, and Mount Mghila in Kasserine governorate due to terrorism – Level 4: Do Not Travel
Terrorist groups continue to operate in mountains of Western Tunisia near the Algerian border.
Visit our webpage for Travel to High-Risk Areas.
Orbata Mountains in Gafsa in West-Central Tunisia – Level 4: Do Not Travel
Terrorist groups continue to operate in the mountainous areas of Western Tunisia near the Algerian border.
Visit our website for Travel to High-Risk Areas.
The Desert South of Remada – Level 4: Do Not Travel
The desert south of Remada is designated as a military zone by the Government of Tunisia. Special authorization is required for travelers wishing to enter the military zone.
Visit our website for Travel to High-Risk Areas.
Date Issued: Wed, 16 Oct 2024
Reissued after periodic reviews with minor edits.
Exercise increased caution when traveling to Türkiye due to terrorism and arbitrary detentions. Some areas have increased risk. Read the entire Travel Advisory.
Do Not Travel To:
- Sirnak province, Hakkari province, and any area within six miles (10 kilometers) of the Syrian border due to terrorism.
Country Summary: Terrorist groups continue plotting possible attacks in Türkiye. Terrorists may attack with little or no warning, targeting tourist locations. Be cautious in transportation hubs, markets, malls, and government buildings, as well as hotels, clubs, restaurants, places of worship, and parks. Be careful in airports and at major events.
Security forces have detained tens of thousands of people, including U.S. citizens, for alleged ties to terrorist groups based on scant or secret evidence and grounds that appear to be politically motivated. U.S. citizens have also been subject to exit bans that prevent them from departing Türkiye. Protests not approved by the Turkish government can lead to arrest, as can criticizing the government, including on social media.
Read the country information page for additional information on travel to Türkiye.
If you decide to travel to Türkiye:
Sirnak Province, Hakkari Province, and Any Area within six miles (ten kilometers) of the Syrian Border – Level 4: Do Not Travel
Do not travel to Sirnak province, Hakkari province, or any area within six miles (10 kilometers) of the Turkey/Syria border due to the continued threat of attacks by terrorist groups, armed conflict, and civil unrest. Terrorist attacks, including suicide bombings, ambushes, car bombs, and explosive devices, as well as shootings and illegal roadblocks leading to violence have occurred in these areas. U.S. government employees are subject to travel restrictions in the entire provinces of Sirnak and Hakkari, and any areas within 10 km of the Syrian border.
Visit our website for Travel to High-Risk Areas.
Date Issued: Fri, 28 Feb 2025
Reissued after periodic review with no changes.
Exercise normal precautions in Turkmenistan.
Please read the country information page for additional information on travel to Turkmenistan.
If you decide to travel to Turkmenistan:
Date Issued: Tue, 04 Mar 2025
Updated to reflect information on traveling with firearms and ammunition.
Exercise increased caution in the Turks and Caicos Islands due to crime.
Country Summary: Most crime occurs in Providenciales. Police may have limited investigatory resources. U.S. Embassy Nassau, located in The Bahamas, provides consular services (including assistance to victims of crime) for U.S. citizens in the Turks and Caicos Islands.
Firearms and ammunition, including single bullets brought by mistake in carry-on bags or luggage, are illegal. Police strictly enforce these laws, even at the airport when travelers are leaving. Travelers face arrest, jail time, and heavy fines. Some U.S. citizens have been detained and unable to depart for several weeks or more after being found with bullets in their luggage. Offenders can face 12 years or more in prison. Though the law allows for some exceptions and discretion, the Department of State cannot guarantee your release.
Read the country information page for additional information on travel to the Turks and Caicos Islands.
If you decide to travel to the Turks and Caicos Islands:
- Check your luggage and hand baggage carefully for bullets or firearms before leaving the United States. Do not bring these items to the Turks and Caicos Islands.
- Avoid walking alone and at night.
- Do not answer your door at your hotel/residence unless you know who it is.
- Do not physically resist any robbery attempt.
- Enroll in the Smart Traveler Enrollment Program (STEP) to receive Alerts and make it easier to locate you in an emergency.
- Prepare a contingency plan for emergency situations. Review the Traveler’s Checklist.
- Visit the CDC page for the latest Travel Health Information related to your travel.
- We highly recommend that you buy insurance before you travel. Check with your travel insurance provider about evacuation assistance, medical insurance, and trip cancellation coverage.
Date Issued: Mon, 02 Dec 2024
Reissued after periodic review without changes.
Exercise normal precautions in Tuvalu.
Read the country information page for additional information on travel to Tuvalu.
Commercial transportation to/from Tuvalu is sporadically available.
If you decide to travel to Tuvalu:
Date Issued: Mon, 08 Dec 2025
Reconsider travel
to Uganda due to crime, terrorism, unrest, and laws targeting persons based on sexual orientation.
Violent crime is a real danger in Uganda. This includes armed robbery, home invasion, and sexual assault. Crime can happen anytime. It is more common in larger cities, the Karamoja region, and along Uganda’s western and northern borders.
Both visitors and residents face these threats. Police struggle to respond to serious crime in most places due to limited resources.
There is risk of terrorist violence, including terrorist attacks and other activity in Uganda. Visit the U.S. Department of State’s country reports on terrorism to learn more.
Terrorist groups have targeted:
- Religious venues
- Schools
- Government buildings
- Police stations
- Transportation hubs
- Areas visited by tourists, including national parks
These attacks have resulted in the deaths of Ugandans as well as foreign visitors. U.S. citizens should remain alert and avoid large public gatherings.
Protests can happen with little to no warning. They often develop around political issues and events, like elections. National elections are set for January 15, 2026. Review the Department of State’s Human Rights Report for your destination prior to traveling.
When protests, strikes, and demonstrations turn chaotic, security services respond with force. They have used batons, rubber bullets, tear gas, and gunfire to break up the crowds.
The 2023 Anti-Homosexuality Act (AHA) criminalizes consensual same-sex relations in Uganda. The law applies to both visitors and residents.
The AHA increases the danger for persons who may be targeted based on their real or perceived sexual orientation, and those accused of “promoting homosexuality.” Penalties include life imprisonment or the death penalty.
Those seen as supporting gay and lesbian people have experienced harassment and violence by vigilantes.
Date Issued: Thu, 14 Nov 2024
Reissued with updates after periodic review.
Do not travel to Ukraine due to Russia’s war against Ukraine. The Department of State continues to advise U.S. citizens to not travel to frontline regions of Ukraine and areas along Ukraine’s border with Belarus due to presence of Russian and Belarusian military and security forces on the Belarusian side of the border, proximity to active ground combat, frequent shelling, missile and drone attacks on populated areas and civilian infrastructure, and limitations on the Embassy’s ability to provide assistance to U.S. citizens in those areas. Read the entire Travel Advisory.
Some regions may have lower level of risk due to air defense capabilities and distance from active combat zones.
Level 3: Reconsider Travel to the regions of Volyn, Lviv, Zakarpattia, Ivano-Frankivsk, Chernivtsi, Ternopil, Rivne, Khmelnytskyi and Zhytomyr.
Russia’s unprovoked full-scale invasion of Ukraine continues, and even non-frontline regions remain subject to Russian missile and drone attacks. Travelers should react to air alerts and seek appropriate shelter. The security situation can change quickly, and travelers should be prepared to depart immediately with little to no warning. Closed airspace restricts travel options, and non-frontline regions are still subject to martial law restrictions, such as a nationwide curfew. U.S. government employees are subject to movement, curfew, and activity restrictions that may be more limited than Ukrainian government restrictions under martial law.
All U.S. citizens should carefully monitor U.S. government notices and local and international media outlets for information about changing security conditions and alerts to shelter in place. The security situation in Ukraine remains unpredictable.
U.S. citizens in Ukraine should stay vigilant and take appropriate steps to increase their security awareness in the event of military attacks. Download and turn on notifications for free mobile applications – which U.S. government personnel in Ukraine are required to have and monitor – that announce air alerts in real time, such as Air Raid Siren and Alarm Map. The U.S. Embassy does not have the ability to provide real-time alerts to the general U.S. citizen community of air threats. Know the location of your closest shelter at all times. In the event of mortar, missile, drone, or rocket fire, follow instructions from local authorities and seek shelter immediately. If you feel your current location is no longer safe, you should carefully assess the potential risks involved in moving to a different location.
On February 24, 2022, the Ukrainian government declared a state of emergency. Each region (oblast) decides on measures to be implemented according to local conditions. Measures could include curfews, restrictions on the freedom of movement, ID verification, and increased security inspections, among other measures. Follow any oblast-specific state of emergency measures.
Ukrainian law does not recognize dual nationality, and Ukraine will not recognize your U.S. citizenship if you are also a citizen of Ukraine. Dual citizens will be treated as Ukrainian citizens while in Ukraine and will be required to use a Ukrainian passport upon entry and exit of the country. Men aged 18-60 with Ukrainian citizenship are also subject to exit restrictions and possible mobilization during the period of martial law. The U.S. Embassy in Kyiv has received numerous reports of dual U.S.-Ukrainian citizens encountering significant difficulties both entering and exiting Ukraine. Travelers with family ties to Ukraine should consult the nearest Ukrainian Embassy or Consulate regarding potential citizenship obligations before entering Ukraine. For more information on traveling with dual nationality, please visit our Travelers with Dual Nationality page.
The Federal Aviation Administration (FAA) has issued a Notice to Air Missions (NOTAM) prohibiting U.S. aviation operations into, out of, within, or over Ukraine. For more information, U.S. citizens should consult the FAA’s Prohibitions, Restrictions, and Notices.
U.S. citizens seeking assistance, including routine services, should email [email protected]. Please review what the U.S. government can and cannot do to assist you in a crisis overseas.
The Embassy is open and operating in Kyiv; however, Embassy personnel are subject to movement, curfew, and activity restrictions, which may cause delays in provision of consular assistance to U.S. citizens outside of Kyiv.
Occupied Territories:
Most of the international community, including the United States and Ukraine, do not recognize Russia’s purported annexation of Crimea in 2014, nor the September 2022 purported annexation of four other Ukrainian oblasts — Donetsk, Luhansk, Kherson, and Zaporizhzhia. There is extensive Russian Federation military presence in many parts of these oblasts. There are also abuses against foreigners and the local population by the occupation authorities in these regions, particularly against those who are seen as challenging Russia’s occupation.
There are instances of Russian forces and their proxies singling out U.S. citizens in Russian-occupied areas of Ukraine for detention, interrogation, or harassment because of their nationality. U.S. citizens have also been singled out when evacuating by land through Russia-occupied territory or to Russia or Belarus.
Although Russia’s occupation severely restricts the Embassy’s access and ability to provide services in these areas, the Department of State and the U.S. Embassy in Kyiv continue to remotely provide certain emergency consular services to U.S. citizens in Crimea as well as four other Ukrainian oblasts partially occupied by Russia – Donetsk, Luhansk, Kherson, and Zaporizhzhia.
Read the country information page for additional information on travel to Ukraine.
Travel to High-Risk Areas:
If you choose to travel to Ukraine, you should consider taking the following steps:
- Visit our website on Travel to High-Risk areas.
- Draft a will and designate appropriate insurance beneficiaries and/or power of attorney.
- Discuss a plan with loved ones regarding care/custody of children, pets, property, belongings, non-liquid assets (collections, artwork, etc.), funeral wishes, etc.
- Share important documents, login information, and points of contact with loved ones so that they can manage your affairs if you are unable to return as planned to the United States.
- Leave DNA samples with your medical provider in case it is necessary for your family to access them.
- Establish your own personal security plan in coordination with your employer or host organization or consider consulting with a professional security organization.
- Develop a communication plan with family and/or your employer or host organization so that they can monitor your safety and location as you travel through high-risk areas. This plan should specify who you would contact first and how they should share the information.
- Enroll your trip in the State Department’s Smart Traveler Enrollment Program (STEP) to receive Alerts and make it easier to locate you in an emergency.
- Follow the Department of State on Facebook and Twitter.
- Prepare a contingency plan for emergency situations. Review the Traveler’s Checklist.
If you are currently in Ukraine:
Date Issued: Fri, 08 Aug 2025
Reissued to reflect current security conditions.
Exercise increased caution in the United Arab Emirates due to the threat of terrorism and missile or drone attacks.
Country Summary: Residents and visitors generally find a safe and secure environment in the UAE. However, elevated regional tensions have aggravated the risk of aerial and other terror attacks across the region. Terrorists may attack with little or no warning and may target tourist locations, transportation hubs, shopping areas, government facilities, places of worship, and in particular locations associated with the Jewish and Israeli communities.
The Federal Aviation Administration (FAA) has issued an advisory Notice to Air Missions (NOTAM) recommending caution for U.S. air carriers and commercial operators operating in the Middle East, including the UAE. For more information, U.S. citizens who plan to travel to the region should check the FAA’s Prohibitions, Restrictions and Notices.
Residents and visitors should be aware the UAE has strict rules on social behavior, drug possession, traffic violations, and financial crimes. Breaking these rules can lead to arrest and/or an exit ban. U.S. citizens should review the Department of State’s Country Information Page for the UAE to learn about local laws, special circumstances, and additional information about travel to the United Arab Emirates. media for breaking events and be prepared to adjust your plans.
Date Issued: Thu, 08 May 2025
Reissued after periodic review with minor edits.
Exercise increased caution in the United Kingdom due to terrorism.
Country Summary:
There is risk of terrorist violence, including terrorist attacks and other activity in the United Kingdom. Visit the U.S. Department of State’s country reports on terrorism to learn more.
Terrorist groups continue plotting possible attacks in the United Kingdom. Terrorists may attack with little or no warning, targeting tourist locations, transportation hubs, markets/shopping malls, local government facilities, hotels, clubs, restaurants, places of worship, parks, major sporting and cultural events, concerts, educational institutions, airports, and other public areas.
There is also risk of isolated violence by dissident groups in Northern Ireland, focused primarily on police and military targets.
Read the country information page for additional information on travel to the United Kingdom.
If you decide to travel to the United Kingdom:
- Be aware of your surroundings when traveling to tourist locations and crowded public venues.
- Follow the instructions of local authorities.
- Check local media for breaking events and adjust your plans based on new information.
- Enroll in the Smart Traveler Enrollment Program (STEP) to receive Alerts and make it easier to locate you in an emergency.
- Review the Country Security Report for the United Kingdom.
- Prepare a contingency plan for emergency situations. Review the Traveler’s Checklist.
- Visit the CDC page for the latest Travel Health Information related to your travel and return to the United States.
- We highly recommend that you buy insurance before you travel. Check with your travel insurance provider about evacuation assistance, medical insurance, and trip cancellation coverage.
Date Issued: Wed, 07 May 2025
Reissued after periodic review with changes.
Exercise increased caution in Uruguay due to crime.
Country Summary:
Crime is most common in these departments:
- Montevideo
- Canelones
- Maldonado
- Rivera
Violent crimes, such as homicides, armed robberies, car jackings, and thefts occur throughout the country. These crimes happen at any time and have affected U.S. citizens. Criminals commonly travel in pairs on motorcycles to approach unsuspecting victims with a weapon and demand personal belongings. Armed criminals also target grocery stores, restaurants, financial centers, and small businesses, in which innocent bystanders are often victimized.
Read the country information page for additional information on travel to Uruguay.
If you decide to travel to Uruguay:
- Be aware of your surroundings, especially when traveling to tourist locations or poorly lit areas.
- Call 911 if you encounter a crime in progress. Do not physically resist any robbery attempt or try to stop a robbery in progress.
- Be vigilant when visiting banks or using ATMs during non-daylight hours or in remote locations; criminals often target ATMs and businesses in the early morning hours.
- Do not leave valuable objects in parked vehicles or in plain sight when driving.
- Do not display signs of wealth, such as wearing expensive jewelry or watches.
- Review your personal and residential security plans.
- Enroll in the Smart Traveler Enrollment Program (STEP) to receive messages and Alerts from the U.S. Embassy and make it easier to locate you in an emergency.
- Review the Country Security Report for Uruguay.
- Prepare a plan for emergency situations. Review the Traveler’s Checklist.
- Visit the CDC page for the latest Travel Health Information related to your travel and return to the United States.
- We highly recommend that you buy insurance before you travel. Check with your travel insurance provider about evacuation assistance, medical insurance, and trip cancellation coverage.
Date Issued: Mon, 26 Jan 2026
Exercise normal precaution in Uzbekistan.
Uzbekistan is generally a safe destination for U.S. travelers.
Date Issued: Thu, 22 May 2025
Updated to reflect lowering the Travel Advisory Level from Level 3 to Level 1 due to ongoing recovery efforts and removal of the Natural Disaster (N) indicator.
Exercise normal precautions in Vanuatu.
Country Summary: Infrastructure and roads in Port Vila and the surrounding area were damaged during the December 2024 earthquake, with repairs in progress.
Read the country information page for additional information on travel to Vanuatu.
If you decide to travel to Vanuatu:
- Monitor local reports and updates from the Vanuatu government and follow all instructions from local authorities.
- Be aware that some areas may still be undergoing repairs, and access could be restricted.
- Keep travel documents up to date and easily accessible.
- Enroll in the Smart Traveler Enrollment Program (STEP) to receive Alerts and make it easier to locate you in an emergency.
- Review the Country Security Report for Vanuatu.
- Visit the CDC page for the latest Travel Health Information related to your travel.
- Prepare a contingency plan for emergency situations. Review the Traveler’s Checklist.
Date Issued: Wed, 03 Dec 2025
Reissued December 3, 2025 after review with no edits.
Do not travel to or remain in Venezuela due to the high risk of wrongful detention, torture in detention, terrorism, kidnapping, arbitrary enforcement of local laws, crime, civil unrest, and poor health infrastructure. All U.S. citizens and Lawful Permanent Residents in Venezuela are strongly advised to depart immediately.
Country Summary: In March 2019, the U.S. Department of State withdrew all diplomatic personnel from U.S. Embassy Caracas and suspended operations. All consular services, routine and emergency, remain suspended until further notice. The U.S. government has no ability to provide emergency services or consular assistance to U.S. citizens in Venezuela. Anyone with U.S. citizenship or any other U.S. residency status in Venezuela should leave the country immediately, including those traveling on Venezuelan or other foreign passports. Do not travel to Venezuela for any reason.
The Department has determined there is a very high risk of wrongful detention of U.S. nationals in Venezuela. Security forces have detained U.S. citizens for up to five years without respect for due process. The U.S. government is not generally informed of the detention of U.S. citizens in Venezuela nor is it permitted to visit U.S. national detainees in Venezuela. The U.S. government has no way to contact U.S. nationals detained in Venezuela, and those detained are not allowed to contact family members or independent legal counsel. According to former detainees, as well as independent human rights organizations, detainees have been subjected to torture and cruel, inhumane, or degrading treatment or punishment, including severe beatings, prolonged restraint in stress positions, and waterboarding.
Violent crimes, such as homicide, armed robbery, kidnapping, and carjacking, are common in Venezuela. Political rallies and demonstrations occur, often with little notice. Police and security forces have instituted a brutal crackdown on pro-democracy or anti-regime demonstrations, including the use of tear gas, pepper spray, and rubber bullets against participants, which occasionally devolve into looting and vandalism.
Colombian terrorist groups operate in Venezuela’s border areas with Colombia, Brazil, and Guyana.
Shortages of gasoline, electricity, water, medicine, and medical supplies continue throughout much of Venezuela.
Read the country information page for additional information on travel to Venezuela.
If you decide to travel to Venezuela:
- Prepare a will and designate appropriate insurance beneficiaries and/or power of attorney.
- Develop a communication plan with family and/or an employer or host organization. A plan should include a “proof of life” protocol with loved ones so that if you are taken hostage, detained, and/or tortured, your loved ones will know specific questions (and answers) to ask the hostage-takers to confirm you are still alive. This will help expose scam artists who attempt to falsely extort your family members by claiming the ability to have you released.
- Consider hiring a professional security organization.
- Any contingency plans for travel to or from Venezuela should not rely on U.S. government assistance.
- The U.S. government cannot assist U.S. citizens in Venezuela in replacing lost or expired travel documents or obtaining Venezuelan entry or exit stamps.
- The U.S. government will not be able to assist should the need for a medical emergency or evacuation arise. U.S. citizens in Venezuela should consider purchasing medical evacuation insurance.
- There is no safe way to travel to Venezuela. Avoid travel to Venezuela via any means, including via land border crossings where even crossing over into Venezuela by a few feet can result in detention. Nighttime travel between cities or between the Maiquetia Simón Bolívar International Airport and Caracas is especially risky. Entering or attempting to enter Venezuela without a valid Venezuelan visa will likely lead to indefinite detention without consular access. Visas are not available upon entry. U.S. citizens in Venezuela face a high risk of indefinite detention without consular access. Visas and residence permits may be canceled at any time without warning, and U.S. citizens holding a valid visa may be arbitrarily detained at any time.
- Department of Transportation Order 2019-5-5, issued in 2019, prohibited all airlines from providing U.S.-Venezuela air services. The Department of Homeland Security requested this action due to risks to civil aviation security in Venezuelan airspace. For more information regarding airspace safety, U.S. citizens should consult the Federal Aviation Administration’s Prohibitions, Restrictions and Notices.
- Travelers face increased risk using unregulated taxis from the Maiquetia Simón Bolívar International Airport and using ATMs in the area.
- Over the counter and prescription medicines are unlikely to be available to U.S. citizens in Venezuela. Bring enough supplies of over the counter and prescription medicines to last your entire stay in Venezuela.
- Access to medical care in Venezuela is limited. Facilities may not have adequate supplies of basic medications.
- Update vaccinations to include all up-to-date standard vaccinations, plus Yellow Fever, Meningitis, Typhoid, Hepatitis A, Hepatitis B, and a Polio booster. All visitors should take Malaria prophylaxis. Venezuela is high risk for Malaria.
- Visit our website for Travel to High-Risk Areas.
- Enroll in the Smart Traveler Enrollment Program (STEP) to receive Alerts.
- Review the Country Security Report for Venezuela.
- Visit the CDC page for the latest Travel Health Information related to your travel.
We highly recommend that you buy travel insurance before you travel. Check with your travel insurance provider about evacuation assistance, medical insurance, and trip cancelation coverage.
Date Issued: Mon, 16 Dec 2024
Reissued after periodic review without changes.
Exercise normal precautions in Vietnam.
Read the country information page for additional information on travel to Vietnam.
If you decide to travel to Vietnam:
Date Issued: Fri, 19 Dec 2025
The Department of State renewed its Travel Advisory for Yemen on December 19, 2025. There were no changes to the advisory level or risk indicators. Advisory summary was updated.
Do not travel to Yemen due to risk of terrorism, unrest, crime, health risks, kidnapping, and landmines.
Advisory summary
U.S. citizens should not travel to Yemen for any reason. The U.S. Embassy in Sana’a suspended its operations in February 2015. The U.S. government is unable to provide emergency or routine consular services to U.S. citizens in Yemen.
Terrorism
The Department of State has re-designated Ansarallah, commonly referred to as the Houthis, as a Foreign Terrorist Organization.
- Other terrorist groups also plan and carry out attacks in Yemen. These include Al-Qa’ida in the Arabian Peninsula (AQAP) and Islamic State affiliates.
- Terrorists may attack with little or no warning and may target:
- Public sites
- Places of worship
- Transportation hubs
- Markets
- Government buildings and facilities
There is risk of terrorist violence, including terrorist attacks and other activity in Yemen. Visit the U.S. Department of State’s country reports on terrorism to learn more.
Review our information on Terrorism and Travel to High-Risk Areas.
Unrest
A civil war continues in Yemen. Although violence has decreased since the April 2022 truce, Yemen still faces instability. Fighting continues, especially near the front lines in central Yemen.
- Travelers should not rely on significant assistance from local authorities.
- Foreigners are frequently targets of kidnapping and carjacking, especially outside of urban areas.
- Have a plan to leave in an emergency that does not depend on U.S. government help. Review our information on Crisis and Evacuations.
- Military conflict has destroyed basic infrastructure like housing, medical facilities, schools, and utilities. This makes it hard to get electricity, clean water, and medical care. Humanitarian groups face obstacles in delivering food, medicine, and water.
Crime
Violent and organized crime is common in Yemen. Local law enforcement may not be able or willing to respond to serious crimes.
Health
Health services in Yemen are poor. There is a re-emergence of diseases like cholera, polio, and measles. They are spreading in Houthi-controlled areas. Medicine and medical supplies are hard to find. Adequate medical treatment for routine and emergency procedures is often not available.
If you decide to travel to Yemen:
- Make sure you have medical or travel insurance that includes medical evacuation. Review our information on Travel Insurance.
- Check with your doctor about required vaccines and shots for high-risk exposure before you go to Yemen.
- Bring enough supply of over counter and prescription medicines to cover the duration of the trip.
- Visit the Centers for Disease Control and Prevention (CDC) website for the latest Travel Health Information for Yemen.
Kidnapping
U.S. citizens, especially dual U.S.-Yemeni citizens, are at high risk of kidnapping and detention in Yemen.
- Young U.S. citizens may be kidnapped for forced marriage. Family members in the United States or Yemen are often involved in these kidnappings.
- The Houthis control Sana’a. They have detained U.S. citizens, including some with dual citizenship.
- U.S. citizens have faced difficulty and delays when trying to leave Yemen.
Review our information on U.S. Citizens Missing Abroad and for Victims of Crime.
Landmines
Landmines and unexploded ordnance exist throughout Yemen. The locations of landmines and unexploded ordnance are often not marked or easy to recognize.
Tourism safety
Do not travel to Socotra or any part of Yemen. Some companies outside Yemen have misrepresented the safety of the Yemeni island of Socotra
- They offer tourist trips with unofficial and invalid “visas.”
- These companies put tourists in danger and legal jeopardy.
- Only the Republic of Yemen government can issue valid Yemeni visas.
The U.S. government cannot assist U.S. citizens in Socotra.
Aviation safety
Limited commercial flights are available from Aden and Sana’a to other airports in the region. Check with airlines and travel companies for the latest flight information.
Due to risks to civil aviation operating within or in the vicinity of Yemen, the Federal Aviation Administration (FAA) has issued a Notice to Airmen (NOTAM) and a Special Federal Aviation Regulation (SFAR). For more information, U.S. citizens should consult the Federal Aviation Administration’s Prohibitions, Restrictions, and Notices.
Maritime travel
Due to risks to commercial shipping operating within or in the vicinity of Yemen territorial waters, the Department of Transportation’s Maritime Administration (MARAD) has issued a Maritime Advisory. For more information, U.S. citizens should consult the Maritime Administration’s Maritime Security Communications with Industry (MSCI).
The U.S. Coast Guard determined Yemeni ports do not have effective anti-terrorism measures. Vessels that arrive in U.S. ports from Yemeni ports must meet additional U.S. Coast Guard conditions of entry as described in the current Port Security Advisory, International Port Security Program – Port Security Advisory.
Mariners and passengers traveling through the ports of Yemen should exercise caution.
If, despite this Travel Advisory, you decide to travel to Yemen:
- Visit our website for Travel to High-Risk Areas.
- Bring enough supply of over-the-counter and prescription medicines.
- Have evacuation plans that do not rely on U.S. government assistance.
- Draft a will and designate appropriate insurance beneficiaries or power of attorney.
- Make a plan with loved ones regarding care/custody of children, pets, property, belongings, non-liquid assets (collections, artwork, etc.), funeral wishes, etc.
- Share important documents, login information, and points of contact with loved ones. This is so that they can manage your affairs if you are unable to return as planned to the United States. Review our International Travel Checklist to prepare for your trip.
- Stay aware of your surroundings.
- Consider hiring a professional security organization.
- Monitor local media for breaking news. Be prepared to adjust your plans.
- Keep travel documents up to date and easily accessible.
- Review local laws and conditions before traveling.
- Before you travel, delete any sensitive photos, comments, or content that might be seen as controversial or inappropriate in your destination. Do this for your social media accounts, cameras, laptops, phones, and other accounts and devices.
- Check with your doctor about required vaccines and shots for high-risk exposure before you go to Yemen. Review the Health section in the Travel Guidance for Yemen.
- Develop a communication plan with family, or your employer or host organization (if you are traveling on business). This is so that they can monitor your safety and location as you travel through high-risk areas. Specify how you’ll confirm you’re safe (texts, calls, etc.), how often, and who you’ll contact first to share the information.
- Appoint one family member to serve as the point of contact if you are taken hostage or detained. Set up a proof-of-life protocol. If you become a hostage, that person will know what questions to ask and answers to expect. This will help them be sure that you are alive (and to rule out a hoax).
- Leave DNA samples with your medical provider in case it is necessary for your family to access them.
- Enroll in the Smart Traveler Enrollment Program (STEP) to get important updates and alerts from the U.S. embassy or consulate. Enrolling helps the U.S. embassy or consulate contact you or your emergency contact in an emergency.
- Review the Country Security Report for Yemen.
- Visit the Centers for Disease Control and Prevention (CDC) website for the latest Travel Health Information for Yemen.
- Prepare a plan for emergency situations. Review the Traveler’s Checklist.
- We highly recommend that you buy insurance before you travel. Check with your travel insurance provider about evacuation assistance, medical insurance, and trip cancellation coverage.
Date Issued: Mon, 31 Jul 2023
Reissued with obsolete COVID-19 page links removed.
Exercise normal precautions in Zambia.
Read the country information page for additional information about travel to Zambia.
If you decide to travel to Zambia:
Date Issued: Tue, 27 Jun 2023
Reissued after periodic review with updates to crime and civil unrest information.
Exercise increased caution in Zimbabwe due to crime and official harassment of U.S. citizens.
Country Summary: Opportunistic crime, such as pickpocketing, theft, and smashing of car windows with intent to steal, is common. Violent crime, such as assault, carjacking, and home invasion, also occurs. Criminals often target foreigners and residents suspected of having large sums of cash.
Demonstrations may occur and increase in frequency around political events, such as elections. Large gatherings are often restricted by the government and can quickly escalate to violence.
Foreigners, journalists, and non-governmental organizations may be subject to heightened scrutiny in Zimbabwe.
Read the country information page for additional information on travel to Zimbabwe.
If you decide to travel to Zimbabwe:
- Stay alert and avoid openly displaying cash.
- Carry a copy of your passport and visa and leave originals in your hotel safe.
- Stay away from political rallies, demonstrations, and crowds.
- Monitor local media for breaking events and be prepared to adjust your plans.
- Keep travel documents up to date and easily accessible.
- Enroll in the Smart Traveler Enrollment Program (STEP) to receive Alerts and make it easier to locate you in an emergency.
- Follow the Department of State on Facebook and Twitter.
- Review the Country Security Report for Zimbabwe.
- Prepare a contingency plan for emergency situations. Review the Traveler’s Checklist.
- Visit the CDC page for the latest Travel Health Information related to your travel.
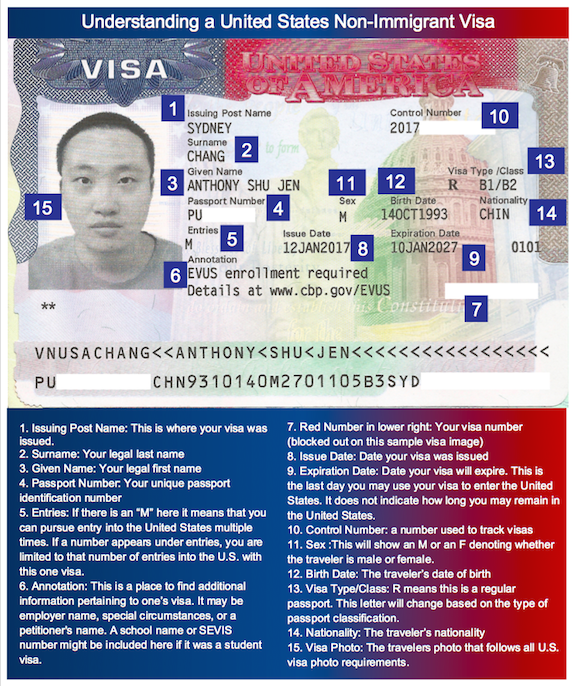
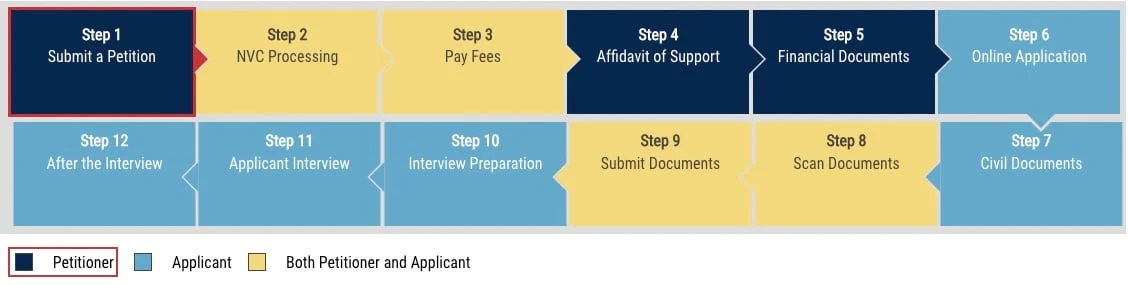

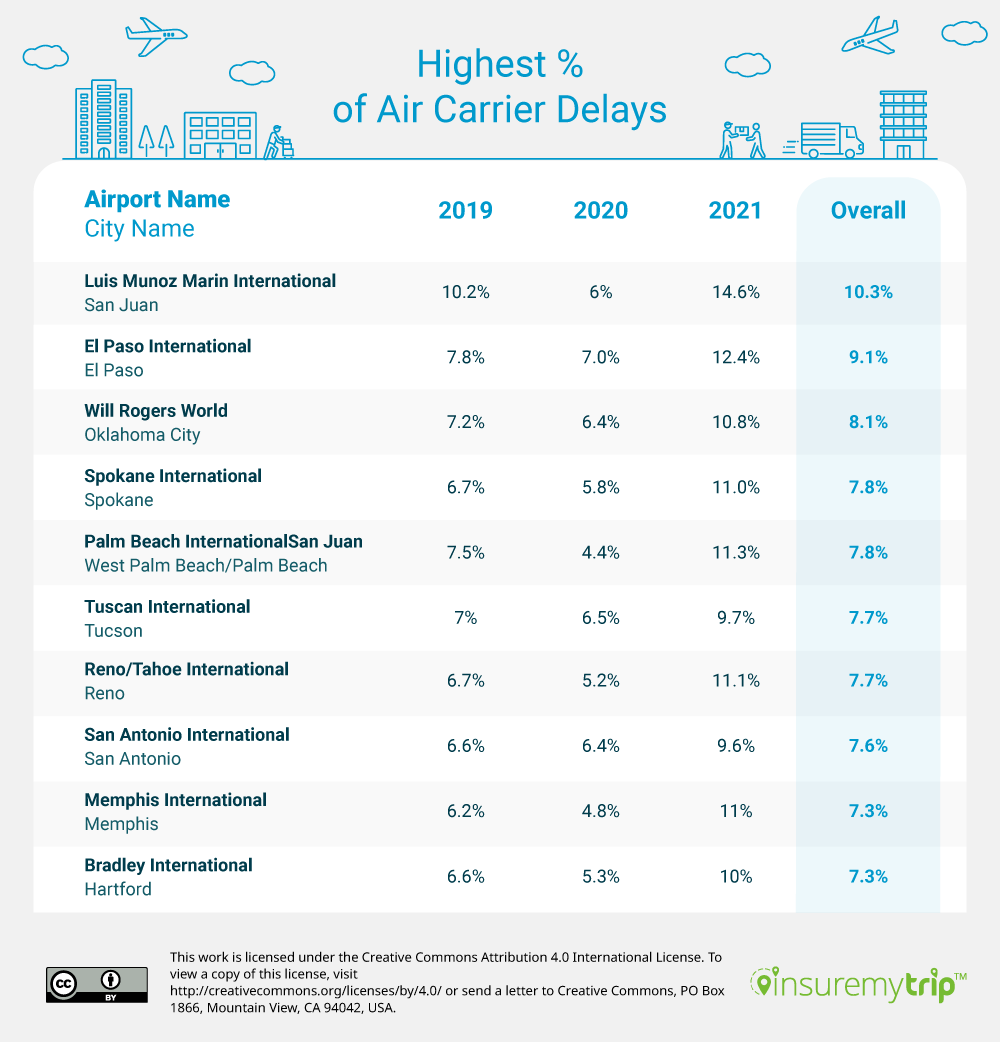
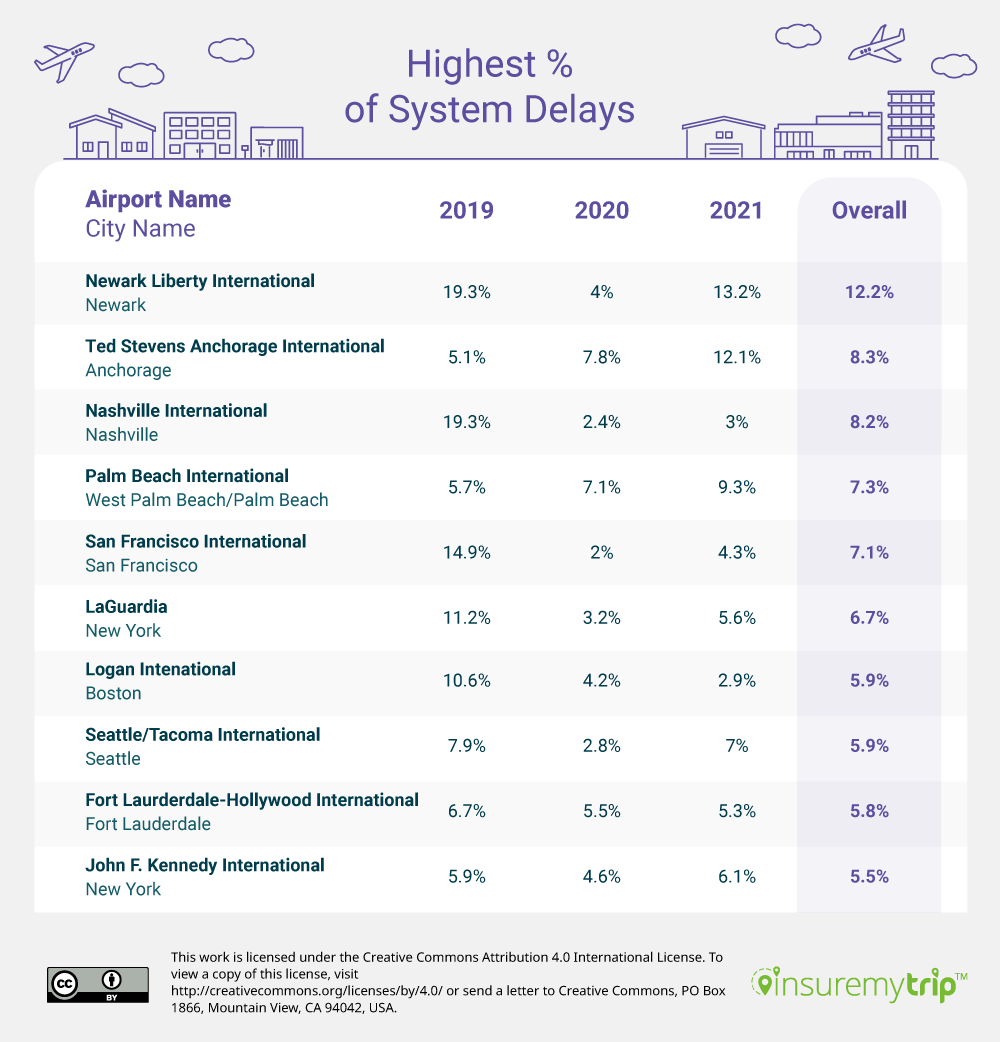
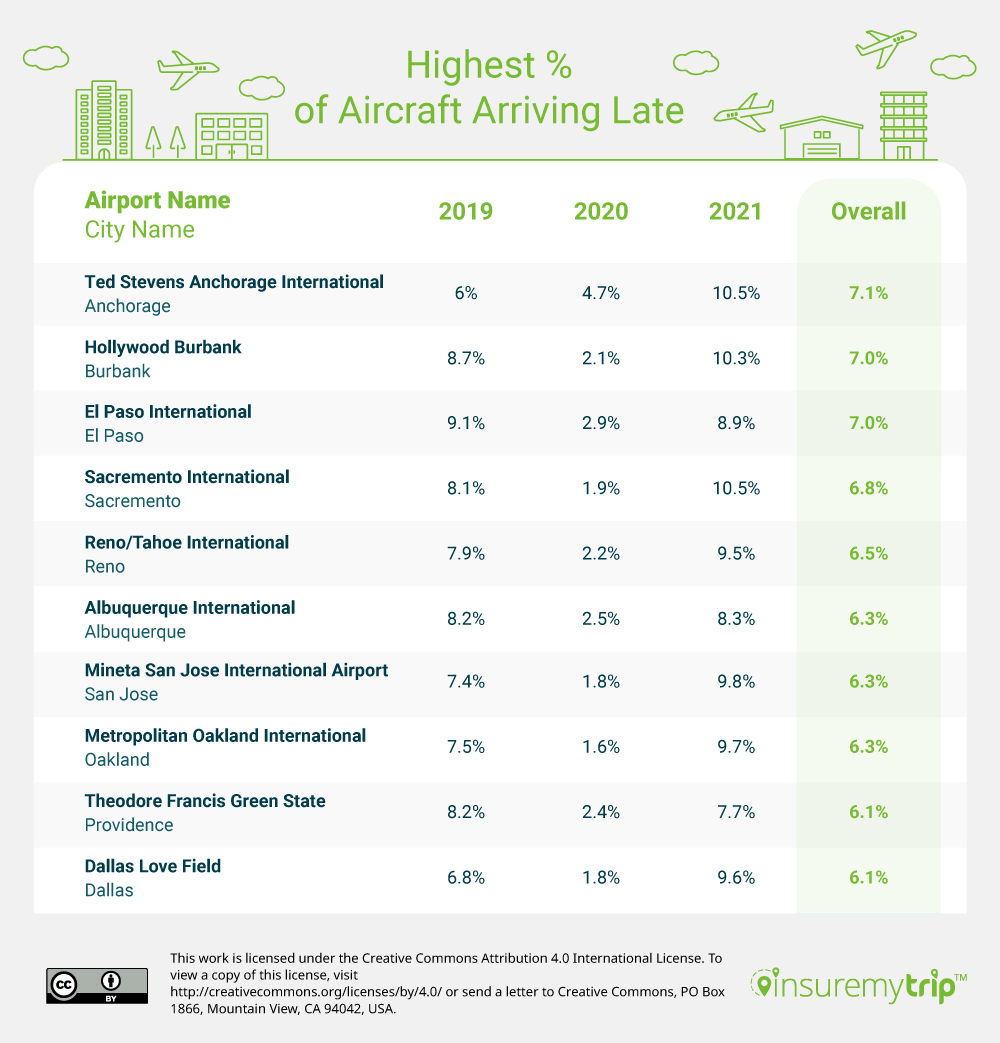


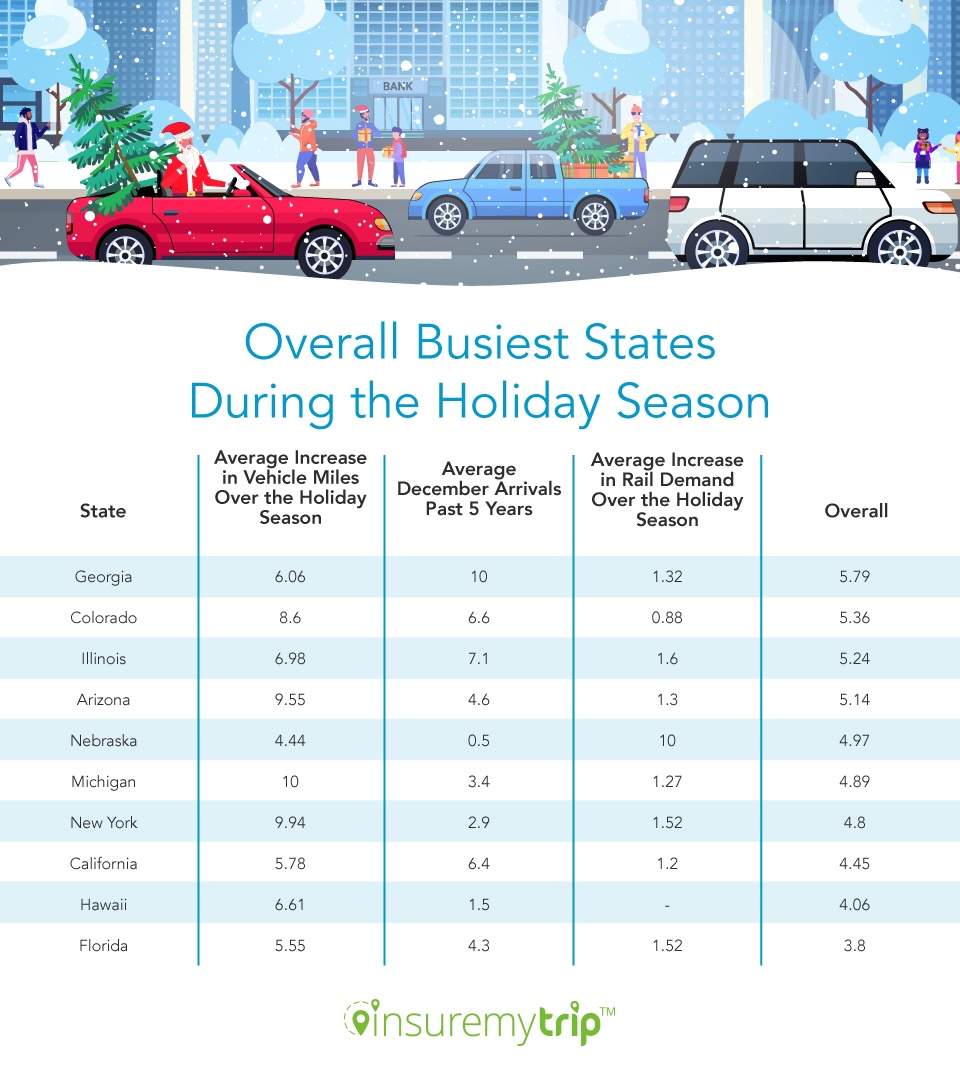
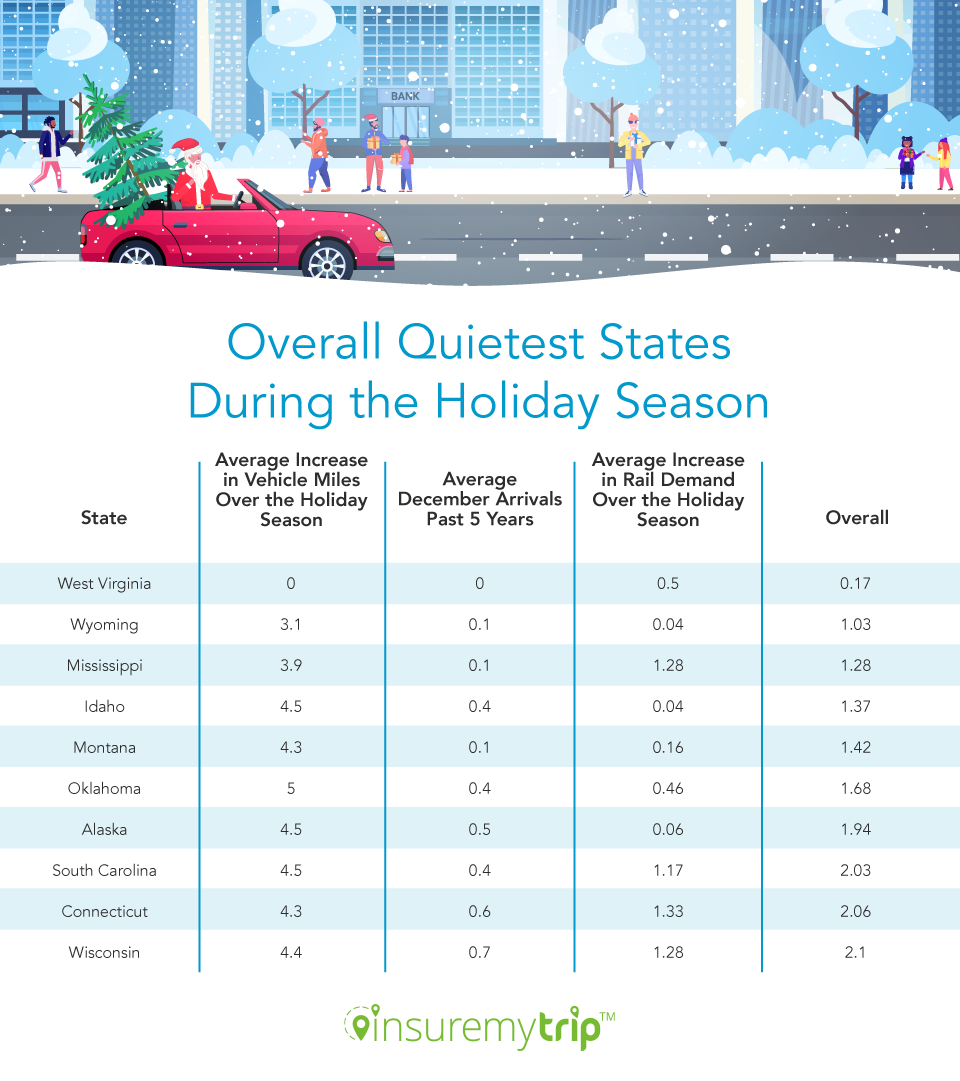
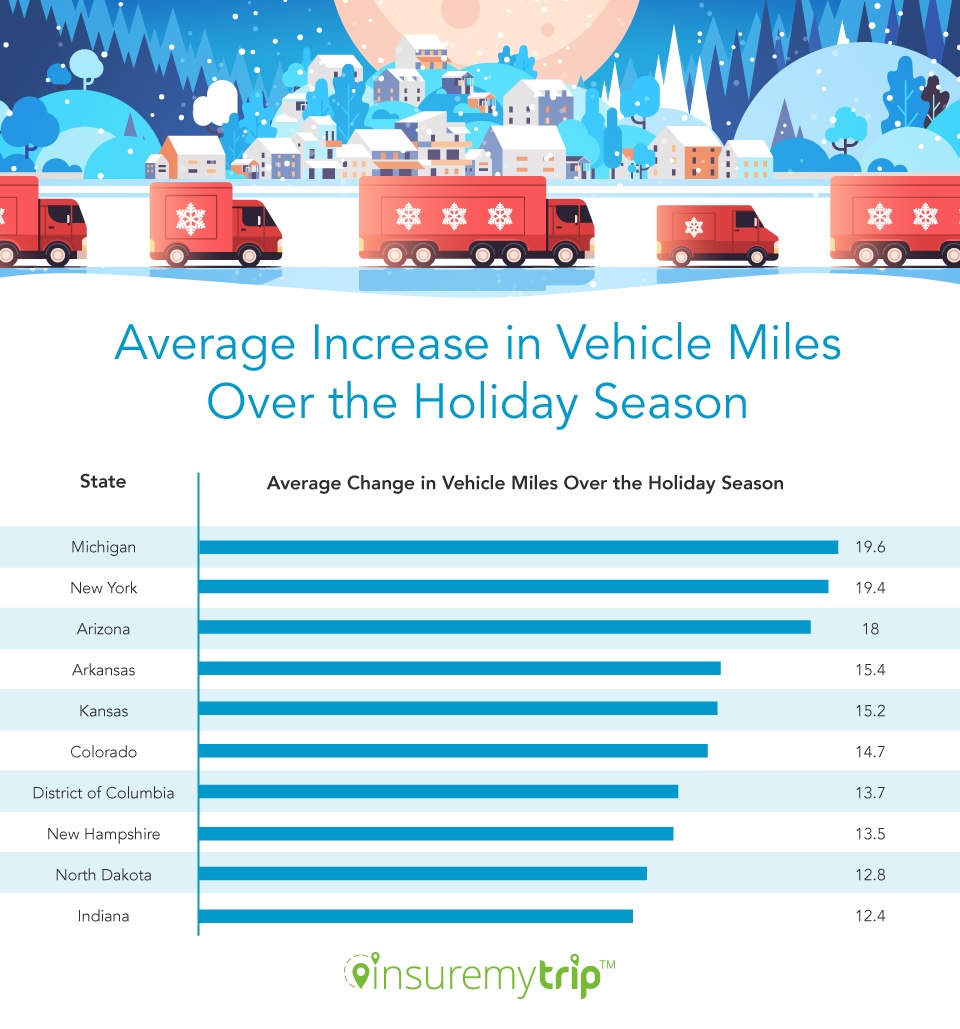
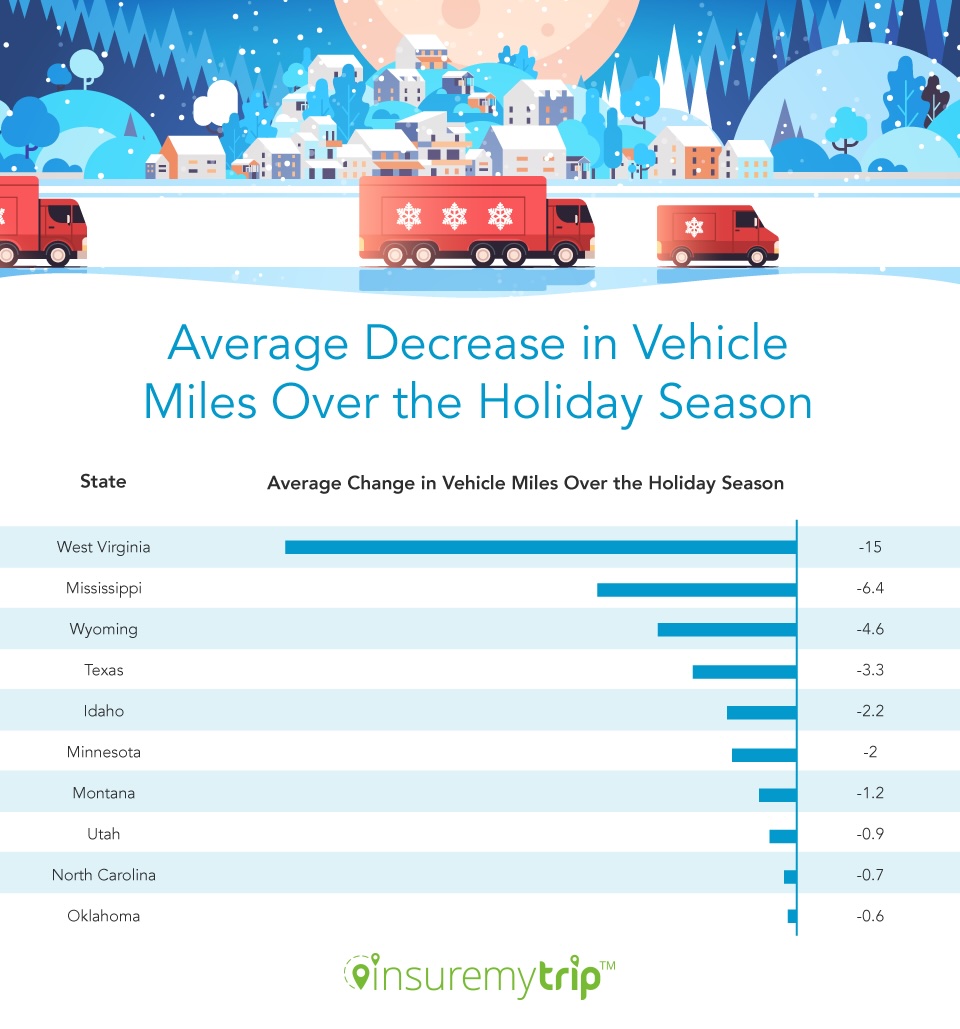
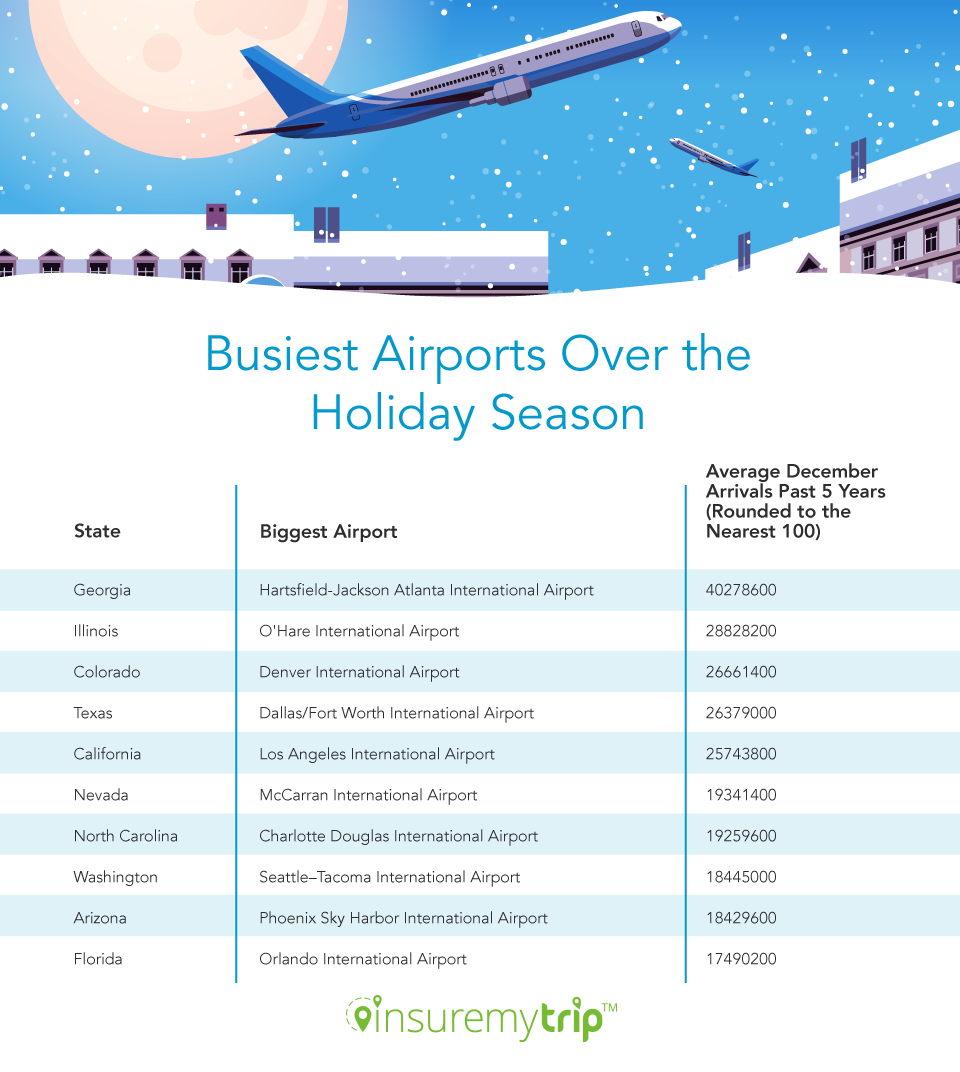
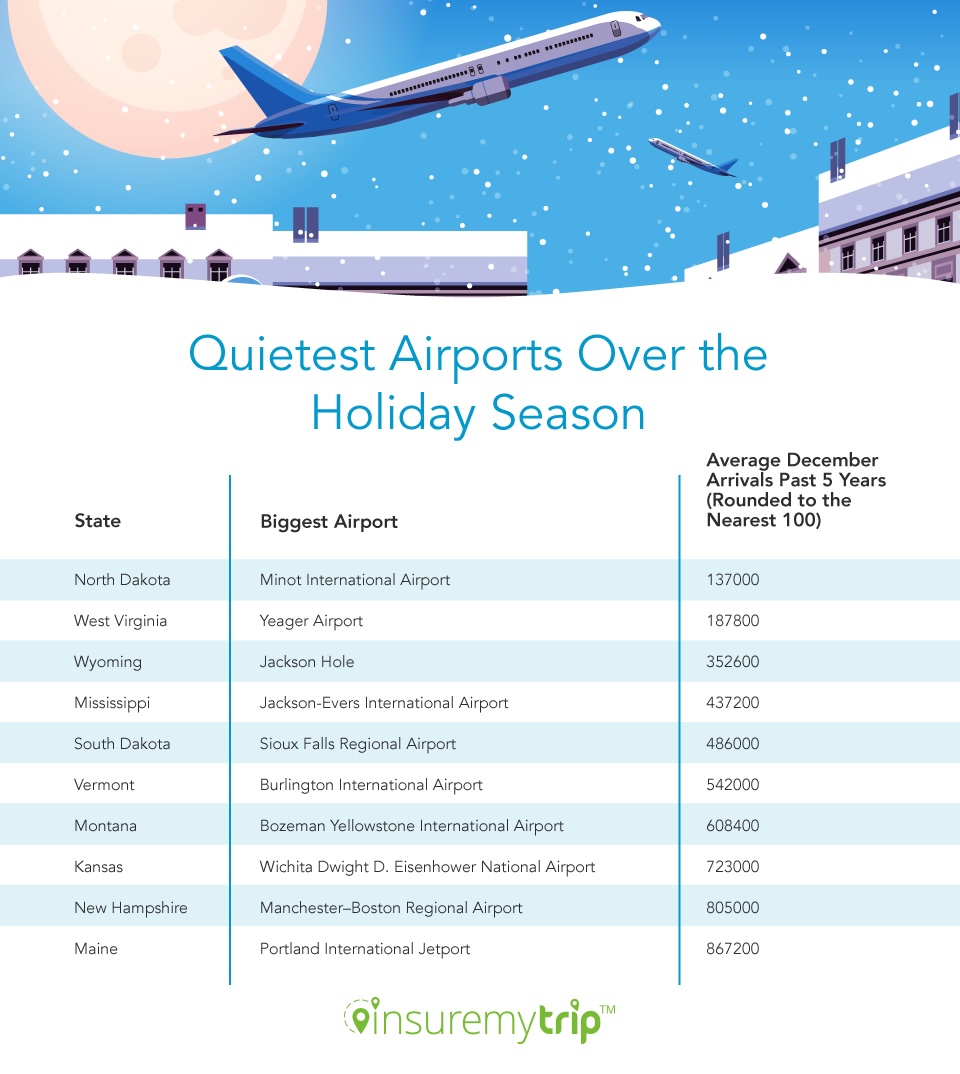
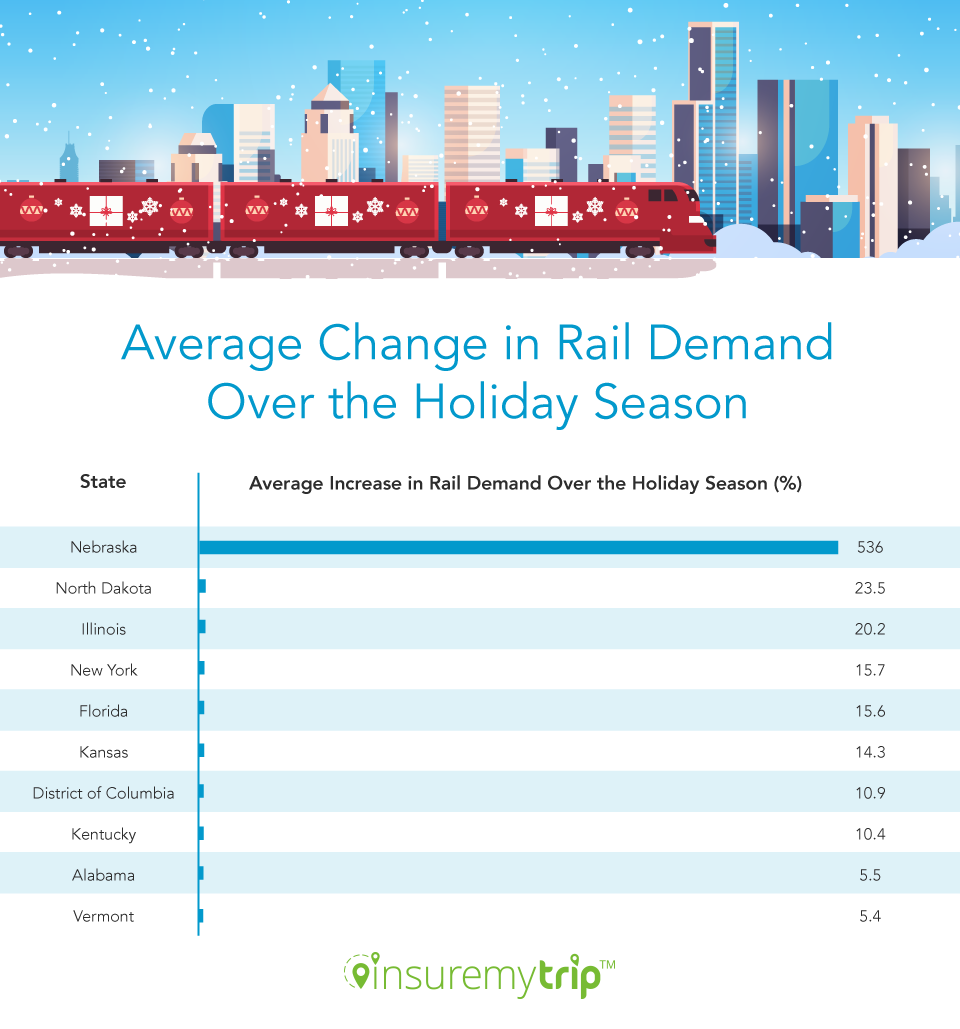
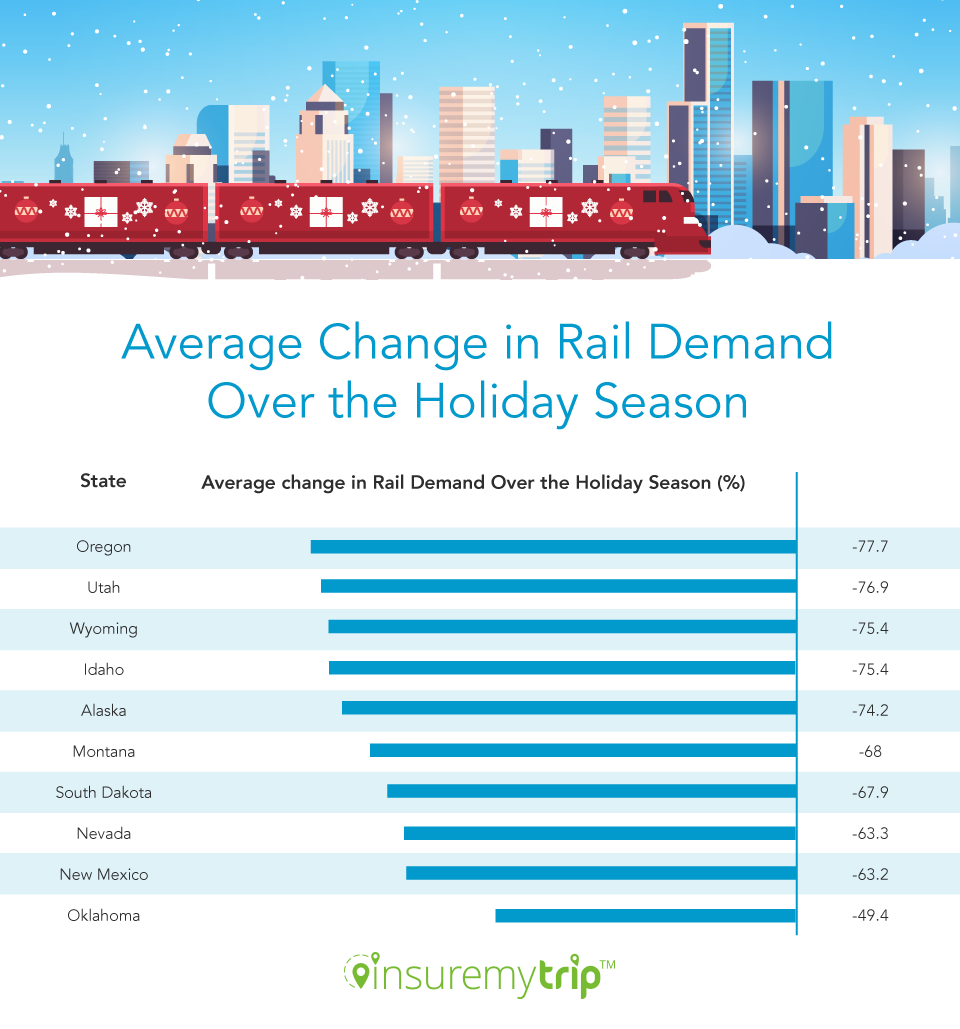

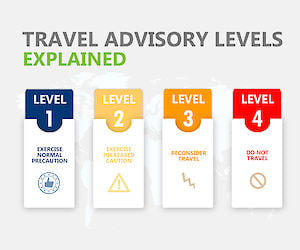 Countries are rated with a Travel Advisory level number 1 through 4, based on their risk level to U.S. travelers. The level numbers advise the following: Level 1 – Exercise Normal Precautions, Level 2 – Exercise Increased Caution, Level 3 – Reconsider Travel, Level 4 – Do Not Travel.
 Level 1 – Exercise Normal Precautions
 Level 3 – Reconsider Travel